. 2005 Mar;3(3):e82.
doi: 10.1371/journal.pbio.0030082. Epub 2005 Mar 8.

Basal immunoglobulin signaling actively maintains developmental stage in immature B cells

Affiliations

Basal immunoglobulin signaling actively maintains developmental stage in immature B cells

Lina E Tze et al. PLoS Biol. 2005 Mar.

Abstract

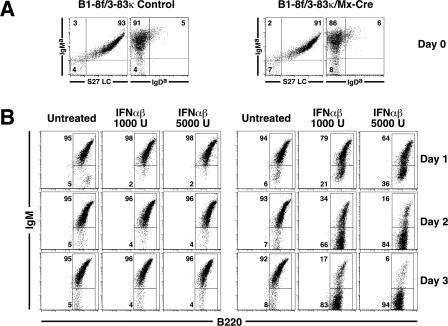
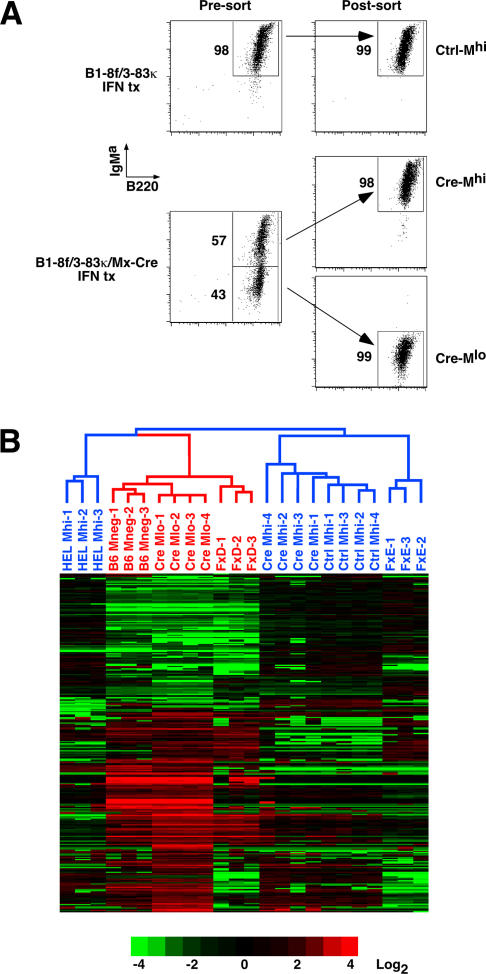
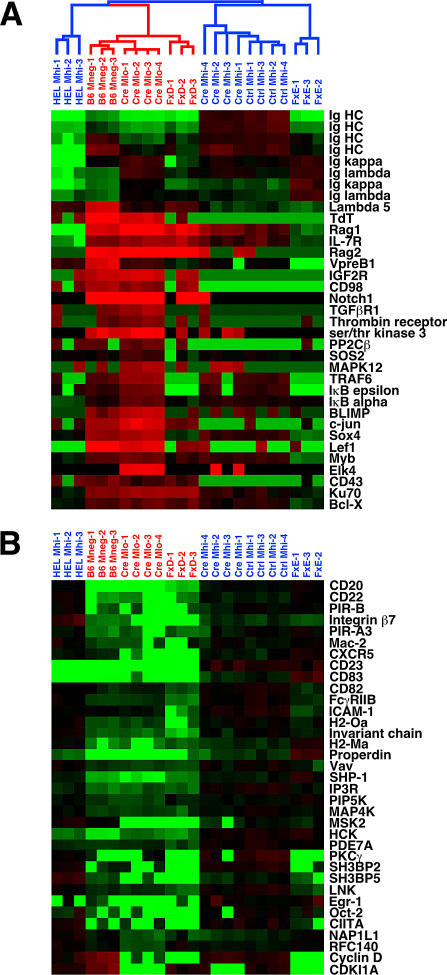
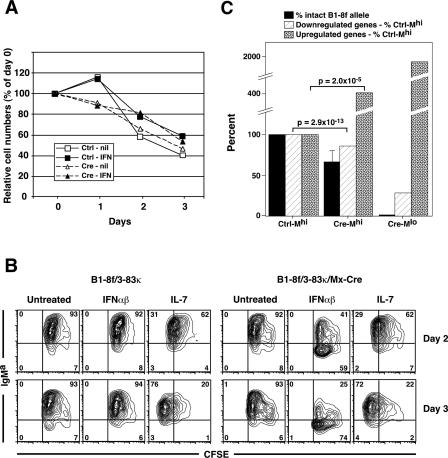
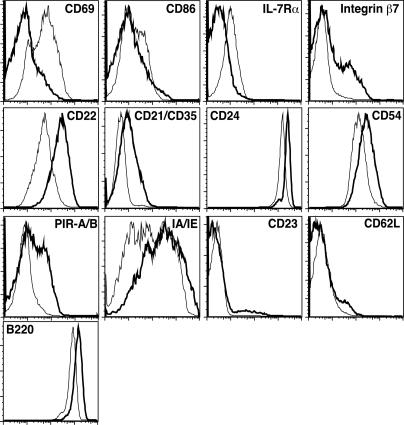
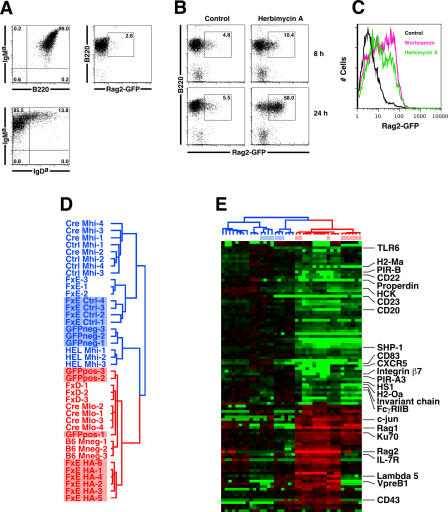
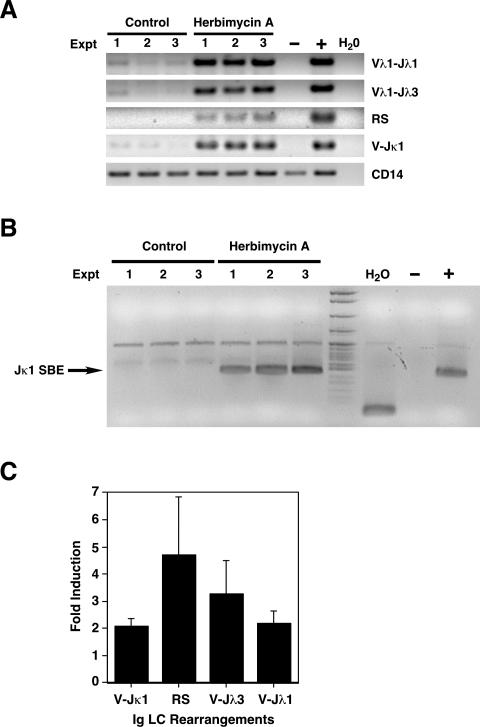
In developing B lymphocytes, a successful V(D)J heavy chain (HC) immunoglobulin (Ig) rearrangement establishes HC allelic exclusion and signals pro-B cells to advance in development to the pre-B stage. A subsequent functional light chain (LC) rearrangement then results in the surface expression of IgM at the immature B cell stage. Here we show that interruption of basal IgM signaling in immature B cells, either by the inducible deletion of surface Ig via Cre-mediated excision or by incubating cells with the tyrosine kinase inhibitor herbimycin A or the phosphatidylinositol 3-kinase inhibitor wortmannin, led to a striking "back-differentiation" of cells to an earlier stage in B cell development, characterized by the expression of pro-B cell genes. Cells undergoing this reversal in development also showed evidence of new LC gene rearrangements, suggesting an important role for basal Ig signaling in the maintenance of LC allelic exclusion. These studies identify a previously unappreciated level of plasticity in the B cell developmental program, and have important implications for our understanding of central tolerance mechanisms.


Figures

Figure 1
Figure 1. Inducible Cre-Mediated Deletion of the B1-8f HC Allele Leads to Loss of Surface Ig from Immature B Cells
(A) Flow cytometry showing surface phenotype of B1-8f/3-83κ and B1-8f/3-83κ/Mx-Cre BM after 5-d IL-7 culture. (B) Flow cytometric analysis of B1-8f/3-83κ and B1-8f/3-83κ/Mx-Cre BM culture cells incubated with IFNαβ (1,000 or 5,000 units/ml), in the absence of IL-7, for 1, 2, or 3 d. The cell populations shown are gated on lymphocytes by forward and side scatter, and then for B220. At the end of the 5-d IL-7 culture, more than 90% of the cells were viable and B220+. The numbers shown indicate the percentage of gated cells.
Figure 2
Figure 2. Microarray Gene Expression Analysis Demonstrates Co-Clustering of Cre-Deleted IgMlo Cells with IgM Cell Populations
(A) FACS sorting strategy for Ctrl-Mhi, Cre-Mhi, and Cre-Mlo immature B cells incubated with IFNαβ (1,000 units/ml) for 2 d. The numbers shown indicate the percentage of gated cells. (B) Affymetrix microarrays were used to identify genes differentially expressed between IFN-treated Ctrl-Mhi and Cre-Mlo cells. Analysis identified 327 transcripts that met the following criteria: 2-fold or greater change in mean expression level, a more than 200-unit difference in mean expression values, and Student's t-test p < 0.01. Individual expression values for each gene were divided by the mean of expression levels for three control IgM+ cell populations: IFN-treated Ctrl-Mhi; IgMhi cells sorted from 5-d IL-7 HEL-lg BM cultures (HEL-Mhi); and sorted from normal Balb/c BM (FxE). Other populations included Cre-Mhi, Hardy Fraction D pre-B cells (FxD) sorted from normal Balb/c BM, and lgM cells sorted from 5-d IL-7 cultures of control B6 BM (B6-M). Data were transformed into log2 space, and represent fold-differences relative to the IgM+ cell populations (see scale bar). Data from 293 transcripts (duplicates and all but four representative Ig HC and LC transcripts removed) were clustered and visualized using CLUSTER and TREEVIEW [51]. Red represents genes expressed at higher levels, while green represents genes expressed at lower levels, than the mean of IgM+ cells. Each column represents an individual sorted cell population.
Figure 3
Figure 3. Genes Differentially Expressed between Ctrl-Mhi and Cre-Mlo Cell Populations
Shown are representative genes that were generally either (A) up-regulated or (B) down-regulated in Cre-Mlo cells compared with Ctrl-Mhi cells. See Figure 2 legend for details.
Figure 4
Figure 4. Gene Expression Phenotype of Cre-Mhi Cell Populations Is Intermediate between Ctrl-Mhi and Cre-Mlo Populations
(A) Viable cell counts were performed in control B1-8f/3-83κ and B1-8f/3-83κ/Mx-Cre cell populations at the initiation of culture with medium alone (nil) or with IFNαβ (IFN) 1,000 units/ml, and daily for 3 d. Data are presented as percent of the day 0 cell numbers, and represent 4–7 experiments for each population. Standard errors were less than 10%, and are not shown. (B) BM cells were cultured for 5 d in IL-7, and were then labeled with CFSE and incubated with 1,000 units/ml IFNαβ or, as a proliferation control, 16 ng/ml IL-7 for an additional 3 d. Flow cytometric analysis of CFSE dye dilution of B220+ cells indicated no significant proliferation of IFN-treated cell populations. Numbers represent percent of gated cells. (C) A PCR-based assay was used to quantitate the extent of B1-8f deletion in Ctrl-Mhi, Cre-Mhi, and Cre-Mlo populations. Ctrl-Mhi cells contained 100% intact B1-8f alleles, Cre-Mlo cells were 100% deleted, and Cre-Mhi cells had 34 ± 16% average deletion of the B1-8f allele. Expression values for the Ctrl-Mhi transcripts (significantly different between Ctrl-Mhi and Cre-Mlo) were normalized to 1, and relative expression levels of transcripts up- (n = 184) and down-regulated (n = 143) in the three populations were calculated. In both groups of genes, Cre-Mhi cells showed intermediate levels of gene expression between Ctrl-Mhi and Cre-Mlo, indicating that Cre-Mlo cells originated from the Cre-Mhi population.
Figure 5
Figure 5. Protein Expression Confirms Reversal of Development in Immature B Cells Losing Surface IgM
B1-8f/3-83κ control and B1-8f/3-83κ/Mx-Cre cell populations were harvested at the end of a 3- or 4-d culture with IFNαβ (3,000 units/ml), stained with mAbs for cell surface proteins, and analyzed by flow cytometry. Shown are the expression levels of B220-gated Ctrl-Mhi (thick line) and Cre-Mlo (thin line) cells at the end of the culture period. Essentially identical results were observed when Cre-Mhi and Cre-Mlo cells were compared (data not shown).
Figure 6
Figure 6. Immature B Cells Undergo a Reversal in Development after Blockade of Basal Ig Signaling with Herbimycin A or Wortmannin
(A) Flow cytometric profile of HEL-Ig/Rag2-GFP BM at the end of a 5-d IL-7 culture. Cells are electronically gated by forward and side light scatter, and represent all lymphoid cells in the culture. The majority of cells were Rag-GFPIgM+IgD immature B cells. (B) After a 5-d IL-7 culture, HEL-Ig/Rag2-GFP cells were washed and incubated with medium alone (containing DMSO carrier) or with 300 ng/ml herbimycin A for 8 or 24 h. Cells were then analyzed by flow cytometry, with cells gated based on size and annexin-V exclusion. Numbers represent percent of gated cells. (C) A representative experiment of Rag2-GFP expression levels in HEL-Ig/Rag2-GFP immature B cells incubated for 24 h with medium alone (black), herbimycin A (300 ng/ml) (green), or wortmannin (30 mM) (pink). (D and E) HEL-Ig/Rag2-GFP BM was cultured in IL-7 for 5 d, and cells were then incubated with herbimycin A (400 ng/ml) for 1 d. IgM+GFP+ [GFPpos (D)] cells were sorted from herbimycin A treated populations, and IgM+GFP [GFPneg (D)] cells were sorted from control cultures. In parallel, immature B cells were sorted from the BM of bcl-2 transgenic mice, and cultured with medium alone for 24 h (FxE Ctrl 1 and -2) or 48 h (FxE Ctrl 3 and 4), or with herbimycin A for 24 h (FxE HA-1, -2, -3, and -4) or 48 h (FxE HA-5 and -6). Total RNA was isolated from the cell populations and biotinylated cRNA probes were generated and hybridized to Affymetrix chips (E). All other cell populations were as described in Figure 2. The array data were clustered using the 101 transcripts from the Ctrl-Mhi/Cre-Mlo gene list that were also differentially expressed between normal FxD (pre-B) and FxE (immature B) cells (using the following criteria: 2-fold or greater change in mean expression level, a greater than 200-unit difference in mean expression values, and Student's t-test p < 0.05). HC and LC transcripts were not used for this clustering analysis. The herbimycin A-treated immature B cells, both cultured and from bcl-2 Tg BM, cluster with more primitive cell populations. Data represent log2 fold-differences, with individual expression values for each gene divided by the mean expression value of the Ctrl-Mhi, HEL-Mhi, FxE, GFP, and FxECtrl populations. Representative genes are annotated.
Figure 7
Figure 7. Immature B Cells That Lose Basal Signaling Show Induction of LC Rearrangements
(A) PCR analysis of endogenous Ig light chain rearrangements (V-Jλ3, V-Jλ1, RS, and V-Jκ1) in genomic DNA of FACS-sorted HEL-Ig/Rag2-GFP BM cells incubated with medium alone or with 300 ng/ml herbimycin A for 24 h. IgMa+GFP+ cells were sorted from herbimycin A-treated cultures, and IgMa+GFP were sorted from control cultures. Data are from three independent experiments. CD14 is a loading control. −, negative control (C57Bl/6J tail DNA); +, positive control (C57Bl/6J spleen DNA). (B) Genomic DNA from the same cell populations described in (A) was subjected to ligation-mediated PCR to detect double-strand signal end DNA breaks at Jκ1. Controls in right three lanes of blot: H2O, control; −, negative control (S17 stroma); +, positive control (C57Bl/6 BM). (C) Genomic DNA was extracted from B1-8f/3-83κ and B1-8f/3-83κ/Mx-Cre immature B cells 3 d following incubation with IFNαβ. Quantitative PCR analysis was used to determine the fold-induction of LC rearrangements in B1-8f/3-83κ/Mx-Cre immature B cells treated with IFN compared to medium alone. Data represent the mean ± standard deviation of two (V-Jλ1), three (V-Jλ3), or four experiments (V-Jκ1, RS).

References

    1. Alt F, Blackwell K, Yancopoulos G. Development of the primary antibody repertoire. Science. 1987;238:1079–1087. - PubMed
    1. Bassing CH, Swat W, Alt FW. The mechanism and regulation of chromosomal V(D)J recombination. Cell. 2002;109(Suppl):S45–55. - PubMed
    1. Rajewsky K. Clonal selection and learning in the antibody system. Nature. 1996;381:751–758. - PubMed
    1. Goodnow CC. Balancing immunity and tolerance: Deleting and tuning lymphocyte repertoires. Proc Natl Acad Sci U S A. 1996;93:2264–2271. - PMC - PubMed
    1. Nemazee D, Weigert M. Revising B cell receptors. J Exp Med. 2000;191:1813–1817. - PMC - PubMed

MeSH terms