. 2005 Mar 7;201(5):675-80.
doi: 10.1084/jem.20041058.

Heterologous T cell immunity in severe hepatitis C virus infection

Affiliations

Heterologous T cell immunity in severe hepatitis C virus infection

Simona Urbani et al. J Exp Med. .

Abstract

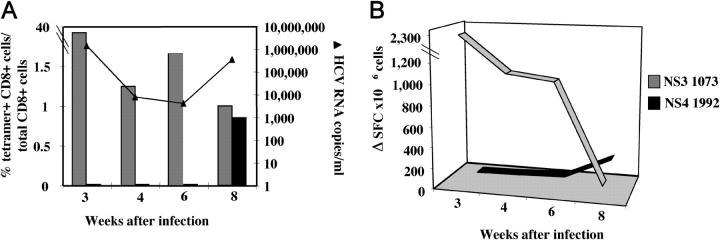
Hepatitis C virus (HCV) can cause liver disease of variable severity. Expansion of preexisting memory CD8 T cells by cross-reactivity with a new heterologous virus infection has been shown in mice to shape the repertoire of the primary response and to influence virus-related immunopathology. To determine whether this mechanism can influence the course of HCV infection, we analyzed the features of the HCV-specific CD8 T cell response in eight patients with acute HCV infection, two of whom had a particularly severe illness. Patients with severe hepatitis, but not those with mild disease, showed an extremely vigorous CD8 T cell response narrowly focused on a single epitope (NS3 1073-1081), which cross-reacted with an influenza neuraminidase sequence. Our results suggest that CD8 T cell cross-reactivity influences the severity of the HCV-associated liver pathology and depicts a model of disease induction that may apply to different viral infections.


Figures

Figure 1.
Figure 1.
Characteristics of the population of patients with acute hepatitis C. (A) Clinical and virological features of the eight patients with acute HCV infection studied. (B) Sequential evaluation of serum ALT levels from the time of clinical presentation. (C) Behavior of serum ALT levels (closed squares), prothrombin activity (open squares), and quantitative (open circles) and qualitative HCV-RNA and anti-HCV antibodies in patient 1.
Figure 2.
Figure 2.
IFN-γ production by direct ex vivo ELISPOT analysis. PBMCs from patients with severe course (A, patients 1 and 2) and with mild course (B, patients 3–5 and 8) of acute HCV infection were stimulated overnight with 119 pools of overlapping 15-mer peptides covering the whole HCV sequence. ELISPOT analysis was performed when the patients first reported to the clinics (Fig. 1 B, day 1). (C) Longitudinal analysis of the T cell response to the 119 pools of overlapping peptides performed in patients 1 and 8 at the indicated weeks after the time of exposure to HCV that was precisely identified. (D) The same sequential study was performed in patients 3 and 5 at the indicated weeks after the first presentation in the clinics (unknown time of infection).
Figure 2.
Figure 2.
IFN-γ production by direct ex vivo ELISPOT analysis. PBMCs from patients with severe course (A, patients 1 and 2) and with mild course (B, patients 3–5 and 8) of acute HCV infection were stimulated overnight with 119 pools of overlapping 15-mer peptides covering the whole HCV sequence. ELISPOT analysis was performed when the patients first reported to the clinics (Fig. 1 B, day 1). (C) Longitudinal analysis of the T cell response to the 119 pools of overlapping peptides performed in patients 1 and 8 at the indicated weeks after the time of exposure to HCV that was precisely identified. (D) The same sequential study was performed in patients 3 and 5 at the indicated weeks after the first presentation in the clinics (unknown time of infection).
Figure 3.
Figure 3.
Peripheral blood frequency of HCV-specific CD8 T cells by ex vivo tetramer staining. (A) Dot plot analysis of HCV NS3 1073 tetramer+ CD8 T cells in patients 1 and 2. (B) Percentage of tetramer+ CD8 T cells specific for five HCV epitopes corresponding to NS3 1073, NS3 1406, NS4 1812, NS4 1992, and NS5 2627 detected ex vivo in PBMCs of five HLA-A2+ patients with acute HCV infection at the time of presentation in the clinics (Fig. 1 A, patients 1–3, 6, and 7). All plots illustrate the results obtained at the first time the patients reported to the clinic.
Figure 4.
Figure 4.
Recognition of HCV NS3 1073 and flu NA 231 peptides by HCV NS3–specific CD8 T cells. (A) Ex vivo IFN-γ ELISPOT analysis. PBMCs from four HLA-A2+ patients with acute HCV infection were stimulated overnight with the peptides NS3 1073, flu NA 231, and flu Matrix 58. The results are expressed as change in spot-forming cells (ΔSFC) per 106 PBMCs. (B and C) CD107a expression and of IFN-γ production by ICS analysis ex vivo. PBMCs from patients 1 and 7 were incubated for 2 h (CD107a expression) or 4 h (IFN-γ production) with HCV NS3 1073, flu NA231, flu MA 51 peptides, or medium alone. (B) Histograms represent CD107a expression in gated HCV NS3 tetramer+ CD8 T cells at the indicated experimental conditions. (C) Plots represent IFN-γ production in gated tetramer+ (top) or tetramer− (bottom) HCV NS3 1073 cells. (D) IFN-γ production in NS3- and Flu-specific T cell lines by ICS analysis. T cell lines produced by 10-d stimulation with the NS3 1073 or the flu NA 231 peptides (top) were stimulated for 4 h in medium alone, with the HCV NS3, with the flu NA, or with a control HLA-A2–restricted MAGE peptide (MAGE 271–279; FLWGPRALV). Numbers at the top of the bars indicate the percentage of IFN-γ–positive CD8 T cells. NS3 1073–specific T cell lines from patients 1 and 7 (bottom) were stimulated at the indicated experimental conditions. Plots are gated on HCV 1073 tetramer+ CD8 T cells. The numbers indicated in each plot represent the percentage of IFN-γ–positive cells among the HCV NS3 tetramer+ CD8 T cell population. No IFN-γ production was detectable in patient 1 upon stimulation with the flu NA 231 peptide in NS3 tetramer− CD8 T cells (not depicted). (E) Cytotoxic activity of HCV NS3 1073–specific T cell lines produced by 10-d stimulation with the NS3 1073 peptide in patients 1 and 3 against HLA-A2+ target cells (E/T ratio = 40:1) incubated in medium alone or pulsed either with the HCV NS3 1073 peptide or with the Flu NA 231 peptide or with a control MAGE peptide. Each bar shows the percentage of 51Cr release at the different experimental conditions described above.
Figure 4.
Figure 4.
Recognition of HCV NS3 1073 and flu NA 231 peptides by HCV NS3–specific CD8 T cells. (A) Ex vivo IFN-γ ELISPOT analysis. PBMCs from four HLA-A2+ patients with acute HCV infection were stimulated overnight with the peptides NS3 1073, flu NA 231, and flu Matrix 58. The results are expressed as change in spot-forming cells (ΔSFC) per 106 PBMCs. (B and C) CD107a expression and of IFN-γ production by ICS analysis ex vivo. PBMCs from patients 1 and 7 were incubated for 2 h (CD107a expression) or 4 h (IFN-γ production) with HCV NS3 1073, flu NA231, flu MA 51 peptides, or medium alone. (B) Histograms represent CD107a expression in gated HCV NS3 tetramer+ CD8 T cells at the indicated experimental conditions. (C) Plots represent IFN-γ production in gated tetramer+ (top) or tetramer− (bottom) HCV NS3 1073 cells. (D) IFN-γ production in NS3- and Flu-specific T cell lines by ICS analysis. T cell lines produced by 10-d stimulation with the NS3 1073 or the flu NA 231 peptides (top) were stimulated for 4 h in medium alone, with the HCV NS3, with the flu NA, or with a control HLA-A2–restricted MAGE peptide (MAGE 271–279; FLWGPRALV). Numbers at the top of the bars indicate the percentage of IFN-γ–positive CD8 T cells. NS3 1073–specific T cell lines from patients 1 and 7 (bottom) were stimulated at the indicated experimental conditions. Plots are gated on HCV 1073 tetramer+ CD8 T cells. The numbers indicated in each plot represent the percentage of IFN-γ–positive cells among the HCV NS3 tetramer+ CD8 T cell population. No IFN-γ production was detectable in patient 1 upon stimulation with the flu NA 231 peptide in NS3 tetramer− CD8 T cells (not depicted). (E) Cytotoxic activity of HCV NS3 1073–specific T cell lines produced by 10-d stimulation with the NS3 1073 peptide in patients 1 and 3 against HLA-A2+ target cells (E/T ratio = 40:1) incubated in medium alone or pulsed either with the HCV NS3 1073 peptide or with the Flu NA 231 peptide or with a control MAGE peptide. Each bar shows the percentage of 51Cr release at the different experimental conditions described above.
Figure 5.
Figure 5.
Kinetics of HCV-specific CD8 T cell–mediated responses in patient 1 analyzed ex vivo by tetramer staining and ELISPOT assay. (A) Percentage of tetramer+ CD8 T cells specific for HCV NS3 1073 (gray bars) and NS4 1992 (black bars) epitopes measured ex vivo at sequential time points from the time of infection. HCV viremia detected by branched DNA assay (lower limit of detection, 2,500 copies/ml) is also illustrated. (B) IFN-γ production analyzed sequentially during the first 10 wk after infection by ELISPOT upon PBMC stimulation with NS3 1073 (gray line) and NS4 1992 (black line) peptides. The results are expressed as ΔSFC per 106 PBMCs.

References

    1. Farci, P., H.J. Alter, A. Shimoda, S. Govindarajan, L.C. Cheung, J.C. Melpolder, R.A. Sacher, J.W. Shih, and R.H. Purcell. 1996. Hepatitis C virus-associated fulminant hepatic failure. N. Engl. J. Med. 335:631–634. - PubMed
    1. SEIEVA Collaborating Group. 2003. Case fatality rate of acute viral hepatitis in Italy: 1995-2000. An update. Dig. Liver Dis. 35:404–408. - PubMed
    1. Welsh, R.M., and L.K. Selin. 2002. No one is naive: the significance of heterologous T-cell immunity. Nat. Rev. Immunol. 2:417–426. - PubMed
    1. Brehm, M.A., A.K. Pinto, K.A. Daniels, J.P. Schneck, R.M. Welsh, and L.K. Selin. 2002. T cell immunodominance and maintenance of memory regulated by unexpectedly cross-reactive pathogens. Nat. Immunol. 3:627–634. - PubMed
    1. Chen, H.D., A.E. Fraire, I. Joris, M.A. Brehm, R.M. Welsh, and L.K. Selin. 2001. Memory CD8+ T cells in heterologous antiviral immunity and immunopathology in the lung. Nat. Immunol. 2:1067–1076. - PubMed

Publication types

Substances