. 2005 Mar 7;201(5):779-91.
doi: 10.1084/jem.20041684.

Intratumor depletion of CD4+ cells unmasks tumor immunogenicity leading to the rejection of late-stage tumors

Affiliations

Intratumor depletion of CD4+ cells unmasks tumor immunogenicity leading to the rejection of late-stage tumors

Ping Yu et al. J Exp Med. .

Abstract

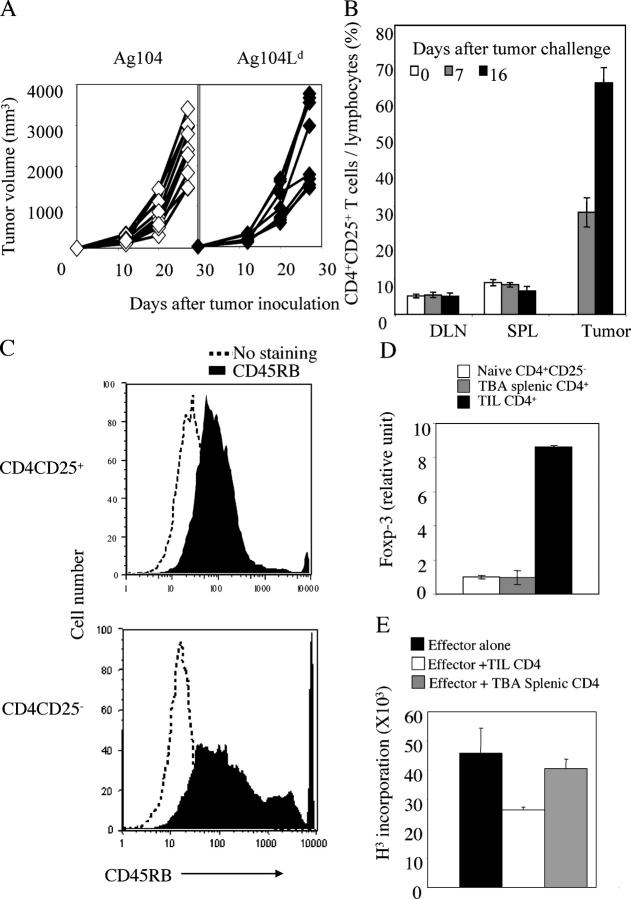
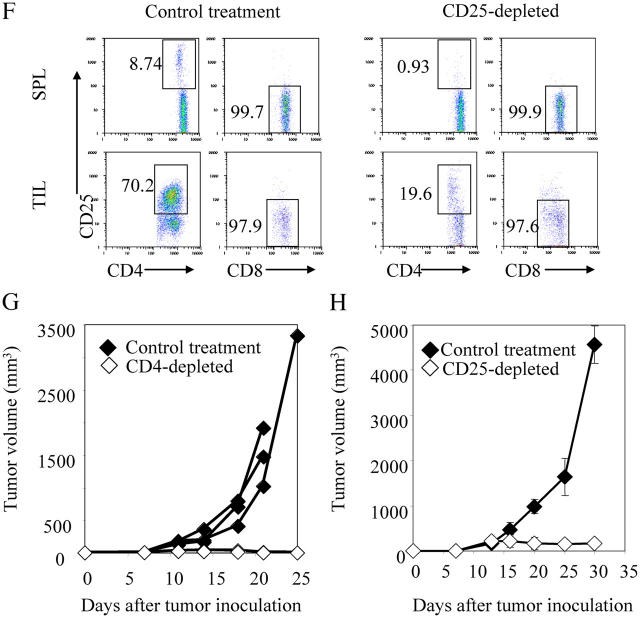
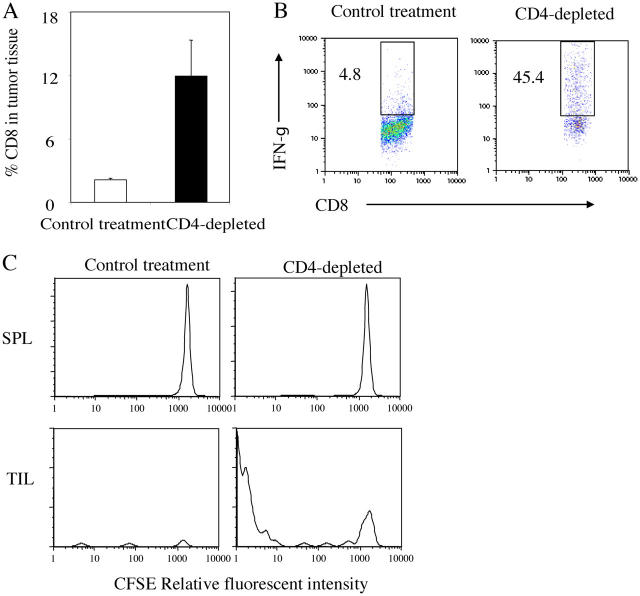
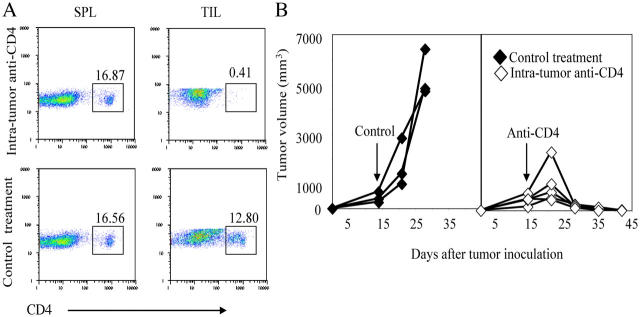
Tumor environment can be critical for preventing the immunological destruction of antigenic tumors. We have observed a selective accumulation of CD4(+)CD25(+) T cells inside tumors. In a murine fibrosarcoma L(d)-expressing Ag104, these cells made up the majority of tumor-infiltrating lymphocytes at the late stage of tumor progression, and their depletion during the effector phase, rather than priming phase, successfully enhanced antitumor immunity. We show here that CD4(+)CD25(+) T cells suppressed the proliferation and interferon-gamma production of CD8(+) T cells in vivo at the local tumor site. Blockade of the effects of IL-10 and TGF-beta partially reversed the suppression imposed by the CD4(+) cells. Furthermore, local depletion of CD4(+) cells inside the tumor resulted in a change of cytokine milieu and led to the eradication of well-established highly aggressive tumors and the development of long-term antitumor memory. Therefore, CD4(+)CD25(+) T cells maintained an environment in the tumor that concealed the immunogenicity of tumor cells to permit progressive growth of antigenic tumors. Our study illustrates that the suppression of antitumor immunity by regulatory T cells occurs predominantly at the tumor site, and that local reversal of suppression, even at a late stage of tumor development, can be an effective treatment for well-established cancers.


Figures

Figure 1.
Figure 1.
CD4+CD25+ T cells accumulate inside the tumor to suppress tumor rejection. (a) A strong antigen Ld does not hinder tumor growth. 5 × 10⁵ Ag104 and Ag104Ld tumor cells were inoculated to C3B6F1 mice s.c. Tumor growth was monitored and volume was calculated as follows: volume = length × width × height/2. Three individual experiments (×3 mice per group) were pooled and shown. (b–e) 106 Ag104Ld tumor cells were inoculated to C3B6F1 mice s.c. at tail base and inguinal LN, spleen, and tumor tissue were isolated from the mice 7 or 16 d after tumor challenge. The percentage of CD4+CD25+ T cells among lymphocytes (b) and the expression of CD45RB on CD4+CD25+ or CD4+CD25 T cells (c) were determined by FACS. Results from pooled three experiments with three mice examined at each time point were shown. Spleen and tumor tissue were collected from these tumor-bearing mice 16 d after tumor challenge. CD4+ T cells were enriched from the spleen with a negative selective bead method using magnetic system. CD4+CD25 T cells from the spleen were further separated from CD4+CD25+ T cells with magnetic system. Tumor-infiltrating T cells were enriched with biotinylated anti-Thy1.2 antibody followed by antibiotin magnetic beads. CD4+ T cells infiltrating the tumor were further isolated with FACS sorting after stained with PE conjugated anti-CD4 antibody. (d) Total RNA was isolated from these purified CD4+ T cell populations and real-time RT-PCR for foxp3 was done on cDNA derived from the RNA. (e) 5 × 10⁴ per well in a 96-well plate purified CD4+CD25 T cells from naive mice were stimulated with optimal dose (2 μg/ml) of coated anti-CD3 antibody for 72 h. Or 5 × 10⁴ CD4+ T cells from tumor tissue or spleen of tumor-bearing mice were added to coculture with purified CD4+CD25 T cells and 3H was added for the last 24 h of culture and its incorporation was measured. Data shown were means and SD. (f) Anti-CD25 antibody was given to mice 14 d after tumor challenge, spleen and tumor tissues were collected 2 d later and the percentage of CD25+ or CD25 cells among CD4 or CD8 cells were compared with the one with control treatment. The representative data from one out of three experiments was shown. Tumor growth was monitored when CD4+ (g) or CD25+ (h) cells were depleted with antibody in vivo. The tumor growth pattern in one experiment representative of seven independent experiments with three to five mice in each group, either CD4-depleted or control group was shown in g. (h) Tumor volume at each time point was measured on 12 mice in each group, either CD25-depleted or control group, done in four independent experiments and data shown were means and SD. The difference in tumor growth between the two groups was significant (P < 0.001, the random effect models for longitudinal data). Tumor sizes were also significantly different between two groups after 20 d after tumor inoculation (P < 0.001, t test).
Figure 1.
Figure 1.
CD4+CD25+ T cells accumulate inside the tumor to suppress tumor rejection. (a) A strong antigen Ld does not hinder tumor growth. 5 × 10⁵ Ag104 and Ag104Ld tumor cells were inoculated to C3B6F1 mice s.c. Tumor growth was monitored and volume was calculated as follows: volume = length × width × height/2. Three individual experiments (×3 mice per group) were pooled and shown. (b–e) 106 Ag104Ld tumor cells were inoculated to C3B6F1 mice s.c. at tail base and inguinal LN, spleen, and tumor tissue were isolated from the mice 7 or 16 d after tumor challenge. The percentage of CD4+CD25+ T cells among lymphocytes (b) and the expression of CD45RB on CD4+CD25+ or CD4+CD25 T cells (c) were determined by FACS. Results from pooled three experiments with three mice examined at each time point were shown. Spleen and tumor tissue were collected from these tumor-bearing mice 16 d after tumor challenge. CD4+ T cells were enriched from the spleen with a negative selective bead method using magnetic system. CD4+CD25 T cells from the spleen were further separated from CD4+CD25+ T cells with magnetic system. Tumor-infiltrating T cells were enriched with biotinylated anti-Thy1.2 antibody followed by antibiotin magnetic beads. CD4+ T cells infiltrating the tumor were further isolated with FACS sorting after stained with PE conjugated anti-CD4 antibody. (d) Total RNA was isolated from these purified CD4+ T cell populations and real-time RT-PCR for foxp3 was done on cDNA derived from the RNA. (e) 5 × 10⁴ per well in a 96-well plate purified CD4+CD25 T cells from naive mice were stimulated with optimal dose (2 μg/ml) of coated anti-CD3 antibody for 72 h. Or 5 × 10⁴ CD4+ T cells from tumor tissue or spleen of tumor-bearing mice were added to coculture with purified CD4+CD25 T cells and 3H was added for the last 24 h of culture and its incorporation was measured. Data shown were means and SD. (f) Anti-CD25 antibody was given to mice 14 d after tumor challenge, spleen and tumor tissues were collected 2 d later and the percentage of CD25+ or CD25 cells among CD4 or CD8 cells were compared with the one with control treatment. The representative data from one out of three experiments was shown. Tumor growth was monitored when CD4+ (g) or CD25+ (h) cells were depleted with antibody in vivo. The tumor growth pattern in one experiment representative of seven independent experiments with three to five mice in each group, either CD4-depleted or control group was shown in g. (h) Tumor volume at each time point was measured on 12 mice in each group, either CD25-depleted or control group, done in four independent experiments and data shown were means and SD. The difference in tumor growth between the two groups was significant (P < 0.001, the random effect models for longitudinal data). Tumor sizes were also significantly different between two groups after 20 d after tumor inoculation (P < 0.001, t test).
Figure 2.
Figure 2.
CD4+ cells suppress the proliferation and IFN-γ production of tumor-infiltrating CD8+ T cells. 106 Ag104Ld tumor cells were inoculated to C3B6F1 mice s.c. and anti-CD4 antibody (GK1.5) was injected i.p. 14 d after tumor challenge. Spleen as well as tumor tissue were isolated from mice 1 wk after CD4 depletion. The percentage of CD8+ T cells in the tumor tissue was determined by FACS (a). The tumor-infiltrating T cells (TIL) were enriched with anti-Thy1.2 magnetic bead system. Spleen cells and purified TIL were stimulated in vitro with PMA and ionomycin in the presence of brefeldin A for 4 h. The percentage of IFN-γ–producing CD8+ T cells among total CD8+ T cells in the tumor was determined by FACS (b). 106 MC57-SIY tumor cells were injected at multiple sites s.c. to 2C TCR transgenic mice in Rag-1 / background to activate 2C T cells. 2C T cells were isolated 96 h after activation and of CD62LloCD44high phenotype. CFSE-labeled activated 2C T cells were adoptively transferred to these Ag104Ld tumor bearing mice with or without CD4 depletion. Tumor tissue was collected from mice 2 d after transfer of 2C T cell. The proliferation of CFSE-labeled 2C T cells was monitored by FACS (c). Results from one experiment representative of three were shown.
Figure 3.
Figure 3.
CD4+ cells maintain an antiinflammatory environment inside the tumor. (a and b) CD4+ cells were depleted by treating the mice with anti-CD4 antibody i.p.1 d before tumor challenge. 106 Ag104Ld tumor cells were inoculated to C3B6F1 mice s.c. and spleen (a) as well as tumor tissue (b) were collected from mice 2 wk after tumor challenge and homogenized. The debris was spun down and the supernatant was collected and subjected to CBA kit. Seven mice from CD4-depleted or control group were used. Data shown were means and SD. (c) 105 Ag104Ld tumor cells were inoculated to C3B6F1 mice s.c. and 100 μg of blocking anti–IL-10 receptor (IL-10R) antibody was injected to mice 1 d before and 7 d after tumor challenge. In combination with anti–IL-10R treatment, 100 μg of LPS or 100 μg of agonistic anti-CD40 antibody was given to mice i.p. 7 d after tumor challenge. Tumor growth was monitored. Data shown were means of tumor volume from 8 to 11 mice in each group and SD. The difference in tumor growth between the control group and all of the treated groups, as well as the anti–IL-10R–treated group with the ones in combination with LPS or anti-CD40 was significant by statistical analysis with the random effect models for longitudinal data (P < 0.001). Statistical analysis with t test also showed that the difference in tumor size between the control group and all of the treated groups was significant after 14 d after tumor inoculation (P < 0.001, t test). The difference in tumor size between group treated with anti–IL-10R antibody and the ones treated in combination with LPS or anti-CD40 groups was significant after 18 d after tumor inoculation (P < 0.001, t test). (d) 105 Ag104Ld tumor cells were inoculated to C3B6F1 mice s.c. and anti-CD4 antibody or 250 μg anti-TGF-β antibody was injected to mice 1 d before and 7 d after tumor challenge. The representative pattern of tumor growth in one experiment was shown.
Figure 4.
Figure 4.
Intratumor depletion of CD4+ cells leads to rejection of established tumor. 105 Ag104Ld tumor cells were inoculated to C3B6F1 mice s.c. and 12.5–50 μg anti-CD4 antibody (GK1.5) was injected intratumorally, once every 7 d, starting 14 d after tumor challenge. The arrow indicated the first treatment. Spleen as well as tumor tissue were isolated from mice 2 d after CD4 depletion. The percentage of CD4+ T cells in the spleen or tumor tissue was determined by FACS (a). Tumor growth was monitored and data shown was representative pattern of tumor growth in one of five experiments comprising 21 mice (b).

Similar articles

Cited by

References

    1. Wick, M., P. Dubey, H. Koeppen, C.T. Siegel, P.E. Fields, L. Chen, J.A. Bluestone, and H. Schreiber. 1997. Antigenic cancer cells grow progressively in immune hosts without evidence for T cell exhaustion or systemic anergy. J. Exp. Med. 186:229–238. - PMC - PubMed
    1. Dunn, G.P., L.J. Old, and R.D. Schreiber. 2004. The three Es of cancer immunoediting. Annu. Rev. Immunol. 22:329–360. - PubMed
    1. Rosenberg, S.A. 1999. A new era for cancer immunotherapy based on the genes that encode cancer antigens. Immunity. 10:281–287. - PubMed
    1. Pardoll, D. 2003. Does the immune system see tumors as foreign or self? Annu. Rev. Immunol. 21:807–839. - PubMed
    1. Monach, P.A., S.C. Meredith, C.T. Siegel, and H. Schreiber. 1995. A unique tumor antigen produced by a single amino acid substitution. Immunity. 2:45–59. - PubMed

Publication types