. 2005 Mar 15;102(11):4033-8.
doi: 10.1073/pnas.0409716102. Epub 2005 Mar 7.

Mechanism of phagolysosome biogenesis block by viable Mycobacterium tuberculosis

Affiliations

Mechanism of phagolysosome biogenesis block by viable Mycobacterium tuberculosis

Isabelle Vergne et al. Proc Natl Acad Sci U S A. .

Abstract

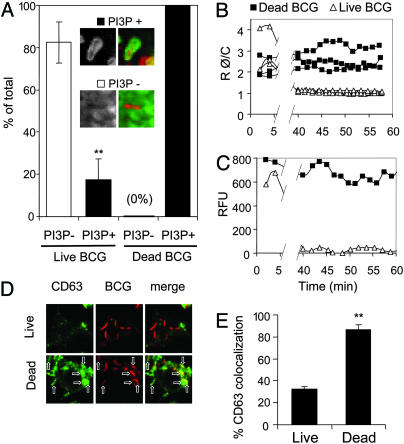
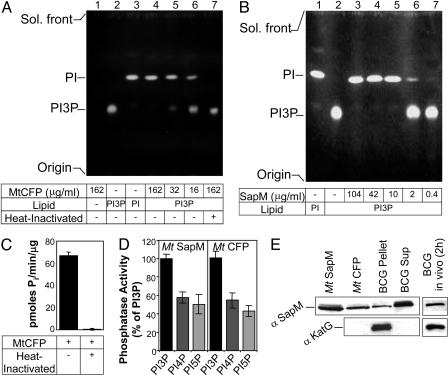
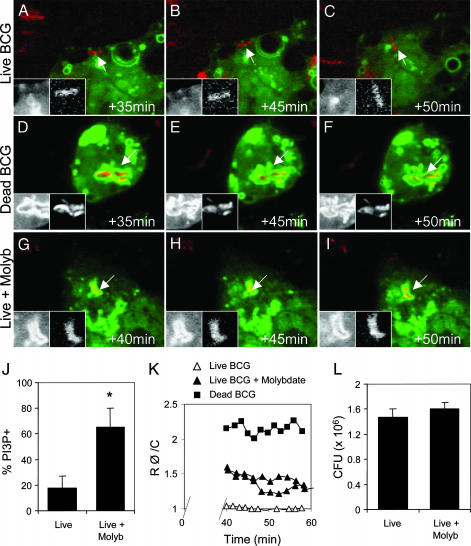
Live Mycobacterium tuberculosis persists in macrophage phagosomes by interfering with phagolysosome biogenesis. Here, using four-dimensional microscopy and in vitro assays, we report the principal difference between phagosomes containing live and dead mycobacteria. Phosphatidylinositol 3-phosphate (PI3P), a membrane trafficking regulatory lipid essential for phagosomal acquisition of lysosomal constituents, is retained on phagosomes harboring dead mycobacteria but is continuously eliminated from phagosomes with live bacilli. We show that the exclusion of PI3P from live mycobacterial phagosomes can be only transiently reversed by Ca2+ fluxes, and that live M. tuberculosis secretes a lipid phosphatase, SapM, that hydrolyzes PI3P, inhibits phagosome-late endosome fusion in vitro, and contributes to inhibition of phagosomal maturation.


Figures

Fig. 1.
Fig. 1.
PI3P persists on phagosomes containing dead but not live M. tuberculosis var. bovis BCG. (A) RAW 264.7 macrophages were transfected with P40PX-EGFP, allowed to phagocytose either live or dead (heat-inactivated) Texas red-labeled BCG, and analyzed by 4D confocal microscopy. Shown is quantification of PI3P positivity of phagosomes containing live or dead BCG (n = 45 live, n = 19 dead). (Insets) GFP fluorescence of the PI3P probe (grayscale) (Left) and merged images of GFP and red mycobacterial fluorescence (Right). **, P < 0.01. (B) Temporal quantification of phagosome fluorescence intensity relative to fluorescence of the cytosol. Rφ/c, ratio between phagosome fluorescence intensity and cytosol fluorescence intensity. Shown are Rφ/c obtained by 4D microscopy and live imaging of three different phagosomes harboring dead BCG (filled squares) and three different phagosomes in cells infected with live BCG (open triangles). (C) Quantification of fluorescence levels over time, expressed in relative fluorescence units (RFU; subtracted for RFU of the cytosol) of a phagosome with dead (filled squares) or live (open triangles) BCG. (D) Confocal immunofluorescence images of fixed specimens containing macrophages infected with live or dead BCG and immuno-stained for CD63. (E) Quantification of CD63 staining of phagosomes.
Fig. 2.
Fig. 2.
De novo generation and maintenance of PI3P on phagosomes harboring dead mycobacteria. RAW 264.7 cells were transfected with P40PX-EGFP, allowed to phagocytose either live or dead BCG (Texas red-labeled), and analyzed by 4D microscopy by using an UltraView microscope. Cells were treated with PI3K inhibitor (100 μM LY294002) as indicated (+LY). LY294002 washout (removal of the inhibitor) is indicated in the fluorescent image panels (–LY) and the graph (arrow). (Insets) Grayscale images of green (Left) and red (Right) fluorescence of areas with objects indicated by arrows. (AC) Absence of PI3P probe on dead BCG phagosomes in cells treated with LY294002, and recruitment of PI3P probe upon LY294002 washout. (DF) PI3P probe status (PI3P-negative) remains unchanged on live BCG phagosomes after a cycle of LY294002 treatment and washout. (G) Time course of phagosomal GFP fluorescence (expressed as percent of the maximum RFU) on dead BCG phagosomes with (open squares) or without (filled squares) LY294002 treatment. Arrow, LY294002 washout.
Fig. 3.
Fig. 3.
M. tuberculosis secretes PI3P phosphatase SapM. (A) TLC (UV fluorescence) of reaction products when PI3P is incubated in the presence of MtCFP. Di-C6-NBD6-PI3P (1 μg) was incubated with different concentrations of MtCFP or boiled MtCFP. Lane 1, MtCFP incubated without Di-C6-NBD6-phosphoinositides; lane 2, Di-C6-NBD6-PI3P incubated without CFP; lane 3, Di-C6-NBD6-PI (product of PI3P hydrolysis) standard; lanes 4–6, Di-C6-NBD6-PI3P incubated with different concentrations of MtCFP; lane 7, Di-C6-NBD6-PI3P incubated with heat-inactivated MtCFP. (B) TLC (UV fluorescence) of reaction products after incubation of PI3P with SapM. Lane 1, Di-C6-NBD6-PI standard; lane 2, Di-C6-NBD6-PI3P incubated without SapM; lanes 3–7, Di-C6-NBD6-PI3P incubated with different concentrations of SapM. (C) PI3P phosphatase activity in MtCFP (40 μg/ml) determined by using malachite green assay. Error bars represent SEM. (D) Comparison of SapM (1.5 μg/ml) and MtCFP (40 μg/ml) phosphatase specificity for phosphatidylinositol monophosphates (PI3P, PI4P, PI5P) determined by using malachite green assay. Error bars represent SEM. (E) Immunoblot comparison of SapM and KatG in MtCFP, bacterial cell extracts (BCG pellet), BCG culture supernatant (BCG Sup), and BCG phagosomes after 2-h infection of J774 macrophages.
Fig. 4.
Fig. 4.
M. tuberculosis var. bovis BCG-secreted PI3P phosphatase is responsible for removal of PI3P from phagosomes harboring live mycobacteria. RAW 264.7 cells were transfected with P40PX-EGFP, allowed to phagocytose either live or dead mycobacteria (Texas red-labeled BCG), and analyzed by 4D microscopy. Infection with BCG was carried out in the presence or absence of sodium molybdate (1 mM) during phagocytosis and subsequent imaging. (AC) Lack of PI3P probe recruitment to phagosomes harboring live BCG. (DF) Recruitment of PI3P probe to phagosomes containing dead BCG. (GI) Recruitment of PI3P probe on phagosomes containing live BCG treated with sodium molybdate. (J) Fraction (%) of live BCG phagosomes (n = 45) and live BCG phagosomes treated with sodium molybdate (n = 18) that recruited the PI3P probe. *, P = 0.02. (K) Temporal analysis and quantification of phagosome fluorescence intensity relative to cytosol fluorescence (Rφ/c). Rφ/c were obtained by processing 4D microscopy images of live cells with phagosomes: harboring dead BCG (filled squares), harboring live BCG-treated with sodium molybdate (filled triangles), or with live BCG (open triangle). (L) Colony-forming units (CFU) of live BCG vs. live BCG treated with sodium molybdate.
Fig. 5.
Fig. 5.
M. tuberculosis-secreted PI3P phosphatase SapM inhibits phagosome–late endosome fusion in vitro. The standard phagosome–late endosome in vitro fusion reaction was carried as described (5), in the presence of 32 μg/ml of purified SapM (Mt SapM). (Inset) Fusion reaction in the presence of 100 nM wortmannin (Wm). Ctrl, untreated control. Error bars represent SEM. *, P < 0.05, n = 3.

Similar articles

Cited by

References

    1. Russell, D. G., Mwandumba, H. C. & Rhoades, E. E. (2002) J. Cell Biol. 158, 421–426. - PMC - PubMed
    1. Vergne, I., Chua, J., Singh, S. B. & Deretic, V. (2004) Annu. Rev. Cell Dev. Biol. 20, 367–394. - PubMed
    1. Sturgill-Koszycki, S., Schlesinger, P. H., Chakraborty, P., Haddix, P. L., Collins, H. L., Fok, A. K., Allen, R. D., Gluck, S. L., Heuser, J. & Russell, D. G. (1994) Science 263, 678–681. - PubMed
    1. Sturgill-Koszycki, S., Schaible, U. E. & Russell, D. G. (1996) EMBO J. 15, 6960–6968. - PMC - PubMed
    1. Vergne, I., Fratti, R. A., Hill, P. J., Chua, J., Belisle, J. & Deretic, V. (2004) Mol. Biol. Cell 15, 751–760. - PMC - PubMed

Publication types

MeSH terms

Substances

LinkOut - more resources