. 2005 May 13;280(19):18822-32.
doi: 10.1074/jbc.M501757200. Epub 2005 Mar 8.

Role of photoreceptor-specific retinol dehydrogenase in the retinoid cycle in vivo

Affiliations

Role of photoreceptor-specific retinol dehydrogenase in the retinoid cycle in vivo

Akiko Maeda et al. J Biol Chem. .

Abstract

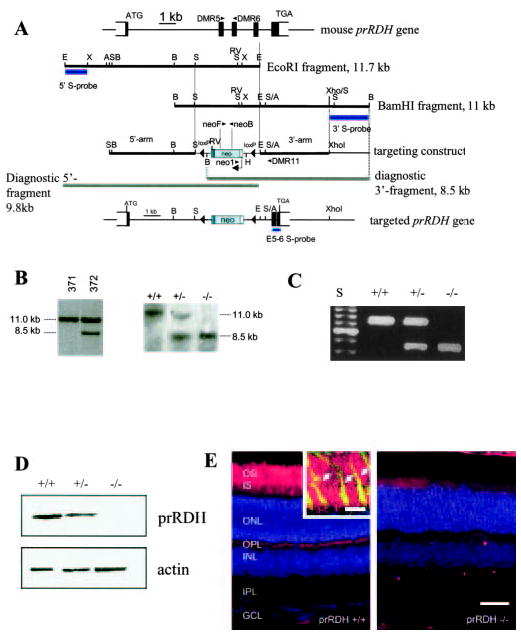
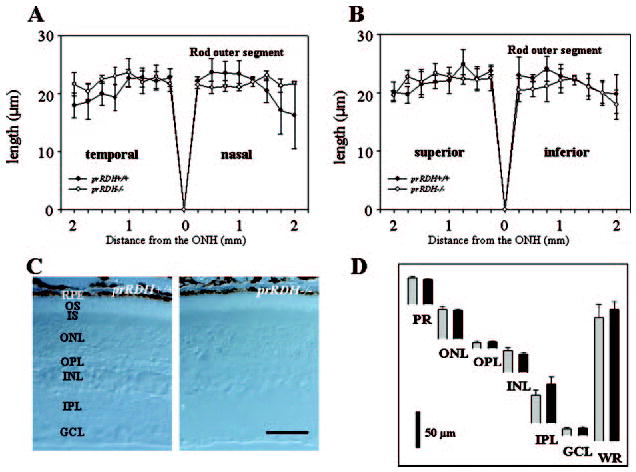
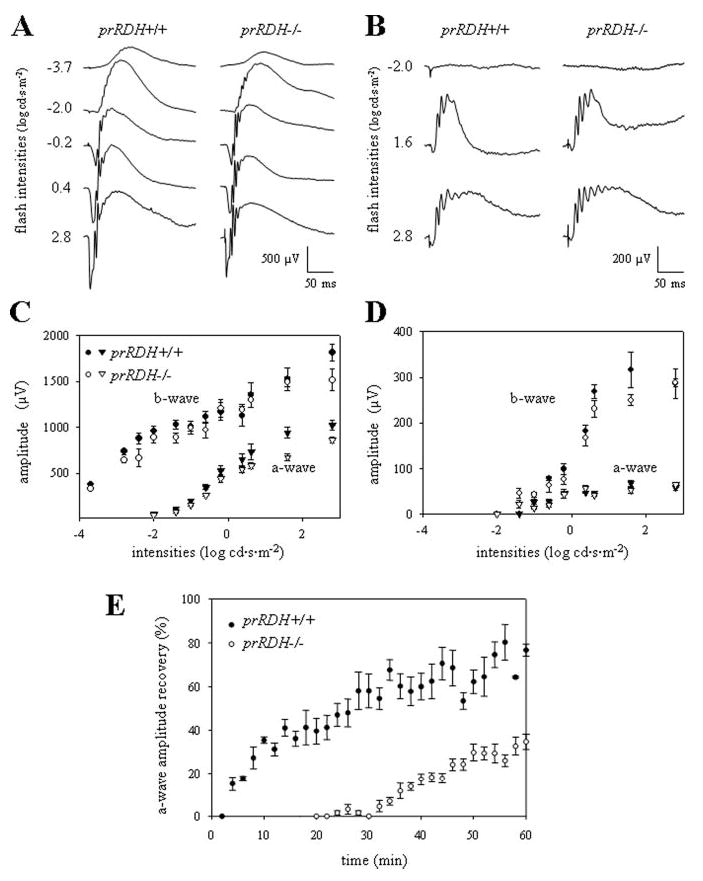
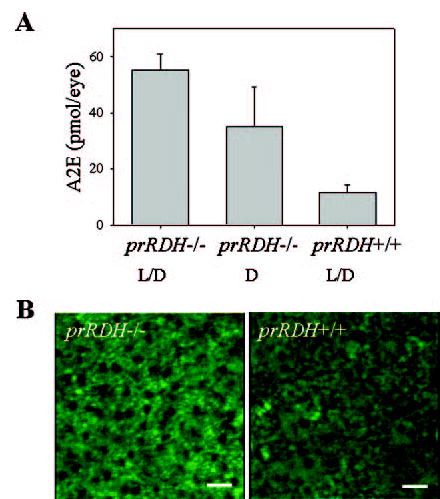
The retinoid cycle is a recycling system that replenishes the 11-cis-retinal chromophore of rhodopsin and cone pigments. Photoreceptor-specific retinol dehydrogenase (prRDH) catalyzes reduction of all-trans-retinal to all-trans-retinol and is thought to be a key enzyme in the retinoid cycle. We disrupted mouse prRDH (human gene symbol RDH8) gene expression by targeted recombination and generated a homozygous prRDH knock-out (prRDH-/-) mouse. Histological analysis and electron microscopy of retinas from 6- to 8-week-old prRDH-/- mice revealed no structural differences of the photoreceptors or inner retina. For brief light exposure, absence of prRDH did not affect the rate of 11-cis-retinal regeneration or the decay of Meta II, the activated form of rhodopsin. Absence of prRDH, however, caused significant accumulation of all-trans-retinal following exposure to bright lights and delayed recovery of rod function as measured by electroretinograms and single cell recordings. Retention of all-trans-retinal resulted in slight overproduction of A2E, a condensation product of all-trans-retinal and phosphatidylethanolamine. We conclude that prRDH is an enzyme that catalyzes reduction of all-trans-retinal in the rod outer segment, most noticeably at higher light intensities and prolonged illumination, but is not an essential enzyme of the retinoid cycle.


Figures

Fig. 1
Fig. 1. The mouse prRDH gene, the targeting construct, and expression
A, mouse prRDH gene structure, targeting construct, and targeted gene in which exons 2–4 have been deleted. The position of WT primers DMR5 and DMR6 in exons 2 and 3, respectively, is indicated. The 11.7-kb EcoRI fragment was used for cloning of the 5′-long arm, and the 11-kb BamHI fragment for cloning of the 3′-short arm. Bars underneath the genomic fragments indicate probes used for Southern blotting of ES cell line candidates. In the targeting construct, a fragment containing exons 2–4 was replaced by a neo cassette flanked by loxP sites. The extent of fragments representing the null allele is shown underneath the targeting construct. Bottom, schematic of the targeted prRDH gene. A, Acc65i; B, BamHI; E, EcoRI, H, HindIII; RV, EcoRV; S, SacI; X, XbaI; and XH, XhoI cleavage sites. In B: Left panel, Southern blot of BamHI-digested DNA of two ES cell lines hybridized with the 3′-probe; #371, negative cell line (no recombination); #372, positive clone showing the 11-kb WT allele and the 8.5-kb null allele. This line was used to generate the prRDH/− mouse. Right panel, Southern blot with BamHI-digested DNA from SvJ WT, prRDH+/−, and prRDH/− mice. The probe (E5–6 S-probe) was a 350-bp genomic fragment containing exon 5, intron 5, and exon 6 (see “Materials and Methods”). C, genotyping of prRDH+/+, prRDH+/−, and prRDH/− mouse lines. The WT fragment was generated by PCR with DMR5 and DMR6 primers. The fragment corresponding to knock-out allele was generated by amplification with neo1 and DMR11 primers. Internal neo primers neoF and neoB (inside the coding sequence of neomycin phosphorylase) were used occasionally as an alternate primer pair. D, immunoblotting of proteins from the ROS extract from prRDH+/+ and prRDH/− mice. The blot was developed using anti-prRDH polyclonal antibody generated against the C-terminal peptide derived from the prRDH sequence (“Materials and Methods”). The equal loading of the sample was verified by immunoblotting with anti-actin polyclonal antibody. E, immunocytochemical localization of prRDH (red) in mouse rod and cone outer segments. Eight-week-old frozen sections were probed with the polyclonal anti-prRDH antibody, generated as described under “Materials and Methods.” The specific response is present in the photoreceptors in the eye of prRDH+/+ mice and not in prRDH/− mice. Scale bar, 50 μm. The nuclear layers were stained with Hoechst 33342 (Molecular Probes, Eugene, OR) dye. Inset, higher magnification of the photoreceptor outer segment layer. Anti-prRDH (red) is immunoreactive to both rod and cones (arrows). Cone sheaths (green) are labeled by fluorescein labeled PNA (peanut agglutinin). Yellow indicates colocalization. Scale bar, 10 μm.
Fig. 2
Fig. 2. Retina histology of prRDH−/− and prRDH+/+ mice
A and B, ROS thickness (in microns) plotted as a function of the retinal location (in millimeters) from the optic nerve head. The age of mice was 8 –10 postnatal weeks. Open circles, prRDH/−; closed circles, prRDH+/+. C, a representative cross-section (Nomarsky optics) of the retina from prRDH+/+ and prRDH/− mice. D, quantification of the thickness of different layers of the retina from prRDH+/+ (black bars) and prRDH/− mice (gray bars) measured at 1.25 mm superior to the optic nerve head. Error bars indicate the standard error of the mean (n > 3). RPE, retinal pigment epithelium; OS, outer segment; IS, inner segment; ONL, outer nuclear layer; OPL, outer plexiform layer; INL, inner nuclear layer; IPL, inner plexiform layer; GCL, ganglion cell layer; and WR, whole retina.
Fig. 3
Fig. 3. Montage of cross-section of the retinas of 2-month-old mice analyzed by transmission EM
Upper panels (A–C) show the cross-section of the RPE and the photoreceptor cells. Lower panels (D–F) show a higher magnification of the RPE and ROS. The sections were prepared as described under “Materials and Methods.” The scale bar represents 10 μm.
Fig. 4
Fig. 4. All-trans-RDH activity in the ROS from prRDH mice and in prRDH-Sf9 cells
A, RDH activity in mouse ROS extract from prRDH/− mice. An aliquot of ROS (5 μg) from prRDH+/+ and prRDH/− mice was suspended in 100 μl of 100 mm MES, pH 5.5, containing 1 mm NADPH or NADH, and 200 μm all-trans-retinal. After 15 min incubation at 37 °C, the all-trans-retinol product was quantified by HPLC (upper panel). In control experiments, nucleotide specificity of prRDH expressed in a heterologous expression system was examined (lower panel). Sf9 cells expressing mouse prRDH were homogenized with 10 mm sodium phosphate (pH 7.5), containing 100 mm NaCl and 1 mm DM. The supernatant was cleared from insoluble particles by centrifugation for 20 min at 10,000 × g, and an aliquot containing 10 μg of protein in 20 μl was mixed with 100 μl of 100 mm MES, pH 5.5, containing 1 mm NADPH or NADH, and 200 μm all-trans-retinal. After 15 min of incubation at 37 °C, the all-trans-retinol product was quantified by HPLC. Untransfected cells were used as negative controls. B, reduction of all-trans-retinal generated from bleached rhodopsin. An aliquot of ROS (5 μg) from prRDH+/+ and prRDH/− mice was suspended in 100 μl of 100 mm MES, pH 5.5, containing 1 mm NADPH or NADH. All-trans-retinal was generated by a flash from a photographic flash lamp (bleaching ~70% of rhodopsin), and the amount of all-trans-retinol produced was quantified by HPLC analysis. Error bars indicate the standard error of the mean (n > 5). *, p < 0.0001.
Fig. 5
Fig. 5. Kinetics of all-trans-retinal reduction and 11-cis-retinal recovery in prRDH+/+, prRDH+/−, and prRDH−/− mice
Retinoids were quantified by HPLC performed on samples collected at different time points after a flash that bleached ~40% of the visual pigment for the pigmented mice (A) and ~80% for the albino mice (B). Closed circles, open circles, and closed triangles represent data obtained from prRDH+/+, prRDH+/−, and prRDH/− mice, respectively. Error bars indicate the standard error of the mean (n > 3). Mice were reared under 24-h dark conditions.
Fig. 6
Fig. 6. Single-flash ERG responses of increasing intensity for prRDH+/+ and prRDH−/− mice
Serial responses to increasing flash stimuli were obtained for prRDH+/+ and prRDH/− mice for selected intensities under dark-adapted conditions (A) and under light-adapted conditions (B). A function of a-wave and b-wave versus light intensity under dark-adapted conditions (C) and light-adapted conditions (D) was plotted. E, measurements of a-wave recovery rates after constant light stimulation. The dark-adapted mice were bleached with intense constant illumination (500 cd·m−2) for 3 min and the recovery of a-wave amplitudes was monitored with single-flash ERG (−0.2 cd·s·m−2) for 60 min. The recovery rate was significantly attenuated in prRDH/− (p < 0.0001) compared with prRDH+/+ mice (n = 5 in each condition).
Fig. 7
Fig. 7. Recovery of 11-cis-retinal after prolonged and intense bleaching in prRDH+/+ and prRDH−/− mice
A, dark-adapted mice were exposed to background light of 500 cd·m−2 for 3 min and returned to the dark. Retinoid analysis by HPLC was performed at 0 and 30 min after the bleach. B, dark-adapted mice were exposed to background light of 500 cd·m−2 for 3 min and returned to the dark. Retinoid analysis by HPLC was performed 30 min after the bleach separately for the retina and the RPE. There is partial unavoidable cross-contamination of the RPE and the retina as measured by the presence of retinyl esters in the retinal fraction and 11-cis-retinal in the RPE. Note that retinal isomers were converted into oximes with hydroxylamine before HPLC separation.
Fig. 8
Fig. 8. Rods from prRDH−/− mice have normal sensitivity but slowed recovery from bleach
A, flash families from prRDH+/+ (left) and prRDH/− (right) rods. Average responses are superimposed for flashes producing 4, 8, 16, 32, 64, and 128 photoactivated rhodopsin molecules (Rho*). Response amplitudes were normalized by the response to the brightest flash. B, recovery of dark current following a ~4% bleach at t = 0. Individual measurements of the dark current (○) were fit with an exponential to estimate the recovery time constant 75 s for the prRDH+/+ rod and 130 s for the prRDH−/− rod. Dark currents were normalized to those determined shortly after initiating the recording. C, recovery of sensitivity following a ~4% bleach. Sensitivity was determined by fitting stimulus-response relations from data like that in A and estimating the flash strength required to produce a half-maximal response. These sensitivity measures were normalized to that determined shortly after starting the recording. Measured sensitivities (○) were fit with an exponential with the same time constant as the dark current data in B.
Fig. 9
Fig. 9. Meta II decay in ROS from prRDH+/+ and prRDH−/− mice
The increase in intrinsic Trp fluorescence of rhodopsin in the ROS from prRDH+/+ (A) or prRDH/− mice (B) was measured. When fitted to the first order reaction, a similar relaxation time (τ) was observed using prRDH+/+ (τA = 18.1 min; τC = 2.6 min) and prRDH/− (τB = 19.3 min; τD = 3.0 min) ROS. The fitted curves of A and B have values of R2 > 0.91.
Fig. 10
Fig. 10. A2E in eyes from prRDH+/+ and prRDH−/− mice
A, quantification of A2E from prRDH/− mice raised in the dark or on a 12-h light/dark cycle, and prRDH+/+ mice raised on a 12-h light/dark cycle, by normal phase HPLC as described under “Materials and Methods.” Error bars indicate the standard error of the mean (n > 5). B, microscopic visualization of lipofuscin ex vivo. Images were obtained from RPE cells, and three-dimensional projections (left, prRDH/−; right, prRDH+/+) were constructed from multiple images. RPE autofluorescence is shown in green. In these experiments, 7- to 9-month-old mice were employed.
Scheme 1
Scheme 1. Release of all-trans-retinal from opsin and its reduction in the vertebrate retina
In the rod outer segment (ROS), light causes the isomerization (reaction a) of the rhodopsin chromophore, 11-cis-retinylidene (1), to all-trans-retinylidene. All-trans-retinal (2) is hydrolyzed and then reduced (reaction b) in the reaction catalyzed by all-trans-retinal-specific RDH(s), including prRDH. All-trans-retinol (3) diffuses to RPE, where it is esterified by lecithin:retinol acyl transferase to all-trans-retinyl esters and stored in subcellular structures called retinosomes.

Similar articles

Cited by

References

    1. Kuksa V, Imanishi Y, Batten M, Palczewski K, Moise AR. Vision Res. 2003;43:2959–2981. - PubMed
    1. McBee JK, Palczewski K, Baehr W, Pepperberg DR. Prog Retin Eye Res. 2001;20:469–529. - PubMed
    1. Filipek S, Stenkamp RE, Teller DC, Palczewski K. Annu Rev Physiol. 2003;65:851–879. - PMC - PubMed
    1. Allikmets R, Singh N, Sun H, Shroyer NF, Hutchinson A, Chidambaram A, Gerrard B, Baird L, Stauffer D, Peiffer A, Rattner A, Smallwood P, Li Y, Anderson KL, Lewis RA, Nathans J, Leppert M, Dean M, Lupski JR. Nat Genet. 1997;15:236–246. - PubMed
    1. Sun H, Molday RS, Nathans J. J Biol Chem. 1999;274:8269–8281. - PubMed

Publication types

MeSH terms