Comparative Study
. 2005 Mar 22;102(12):4252-7.
doi: 10.1073/pnas.0500607102. Epub 2005 Mar 8.

On the utility of pooling biological samples in microarray experiments

Affiliations
Comparative Study

On the utility of pooling biological samples in microarray experiments

C Kendziorski et al. Proc Natl Acad Sci U S A. .

Abstract

Over 15% of the data sets catalogued in the Gene Expression Omnibus Database involve RNA samples that have been pooled before hybridization. Pooling affects data quality and inference, but the exact effects are not yet known because pooling has not been systematically studied in the context of microarray experiments. Here we report on the results of an experiment designed to evaluate the utility of pooling and the impact on identifying differentially expressed genes. We find that inference for most genes is not adversely affected by pooling, and we recommend that pooling be done when fewer than three arrays are used in each condition. For larger designs, pooling does not significantly improve inferences if few subjects are pooled. The realized benefits in this case do not outweigh the price paid for loss of individual specific information. Pooling is beneficial when many subjects are pooled, provided that independent samples contribute to multiple pools.


Figures

Fig. 1.
Fig. 1.
Schematic of the designed experiment. Each box represents one array; X's indicate samples that were not hybridized (A13, A15, B4, B7) or were hybridized but not used in construction of the pools (A1, B1). Here, A is control and B is treatment.
Fig. 6.
Fig. 6.
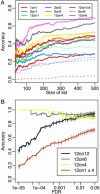
Design accuracy. (A) Lists of fixed size. Solid lines give the average performer across 100 subsets; dashed lines give the worst case performer. (B) Lists with fixed FDR. Each vertical tick on the FDR plot marks 100 genes identified at the specified level of FDR (see Comparison of Designs for more details on the construction of each figure). Virtually identical results were obtained if CEL files were processed by using RMA within pool group (see Fig. 12).
Fig. 2.
Fig. 2.
Gene-specific sample variances: cumulative distribution functions of gene specific sample variances are calculated by combining estimates across biological conditions. Density estimates are shown in Fig. 11.
Fig. 3.
Fig. 3.
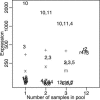
Distorted gene. Expression values are shown for individuals, pools, and technical replicates. The + (x) indicates the mathematical average of the raw (log) data; the m indicates the median of the values. The numbers refer to arrays (control condition). Of importance here are arrays 3 and 10, where expression values for this gene differ from the majority. The effects of arrays 3 and 10 are attenuated by the values they are pooled with (11 and 2, respectively, for the pools of two).
Fig. 4.
Fig. 4.
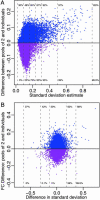
Effects of distortion within and between conditions. (A) The mean difference between the pools of two and the corresponding averages across individuals (control condition) as a function of standard deviation (SD) estimated within the control condition (all genes are shown). The units are log base-2 expression. The percentiles of SD are shown (bottom) along with the percentage of genes (top) having values in the pools of two that are larger than the corresponding average across individuals. Genes with values in the pools that are higher (lower) than the corresponding averages are shown in blue (purple). For the 25% of the genes with largest SD, >80% have values larger in the pools of two. Similar results were found by using estimates of either technical or biological SD. The treatment condition and pools of three give similar results. (B) The difference between the log fold change (FC) values (control/treatment) calculated from the pools of two and the individuals for the genes shown in A plotted as a function of the difference in SD calculated across conditions. B is unitless because we are considering the difference in log fold change. Distortion affects both control and treatment and largely cancels out when FCs are considered resulting in similar FC values in the individuals and pools.
Fig. 5.
Fig. 5.
DE inferences without biological replication. Expression values from three genes are shown. Technical replicates for genes 1 and 2 are shown in columns C1 and C3. By considering these technical replicates only, the first two genes might be considered DE by some measures (because the averages in each group are quite different); when biological replicates are considered for these two genes (columns C2 and C4), it is obvious that the difference in means is caused by three outliers (first gene) and underestimation of the biological variance (second gene). DE calls for gene 3 would be the same, whether considering biological or technical replicates; +, x, and m are defined in Fig. 3.

References

    1. Jin, W., Riley, R. M., Wolfinger, R. D., White, K. P., Passador-Gurgel, G. & Gibson, G. (2001) Nat. Genet. 29, 389–395. - PubMed
    1. Saban, M. R., Hellmich, H., Nguyen, N., Winston, J., Hammond, T. G. & Saban, R. (2001) Physiol. Genomics 5, 147–160. - PubMed
    1. Chabas, D., Baranzini, S. E., Mitchell, D., Bernard, C. C., Rittling, S. R., Denhardt, D. T., Sobel, R. A., Lock, C., Karpuj, M., Pedotti, R., et al. (2001) Science 294, 1731–1735. - PubMed
    1. Waring, J. F., Jolly, R. A., Ciurlionis, R., Lum, P. Y., Praestgaard, J. T., Morfitt, D. C., Buratto, B., Roberts, C., Schadt, E. & Ulrich, R. G. (2001) Toxicol. Appl. Pharmacol. 175, 28–42. - PubMed
    1. Enard, W., Khaitovich, P., Klose, J., Zollner, S., Heissig, F., Giavalisco, P., Nieselt-Struwe, K., Muchmore, E., Varki, A., Ravid, R., et al. (2002) Science, 296, 340–343. - PubMed

Publication types

MeSH terms

Associated data