

Identification of transcribed sequences in Arabidopsis thaliana by using high-resolution genome tiling arrays
- PMID: 15755812
- PMCID: PMC555476
- DOI: 10.1073/pnas.0408203102
Identification of transcribed sequences in Arabidopsis thaliana by using high-resolution genome tiling arrays
Abstract
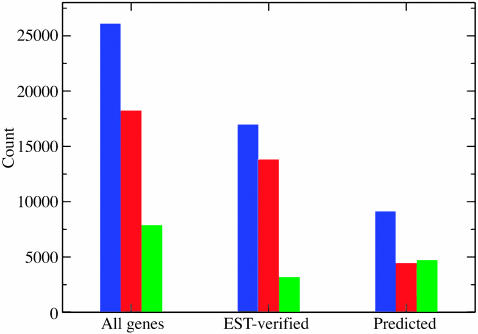
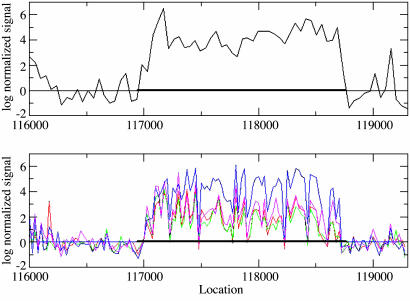
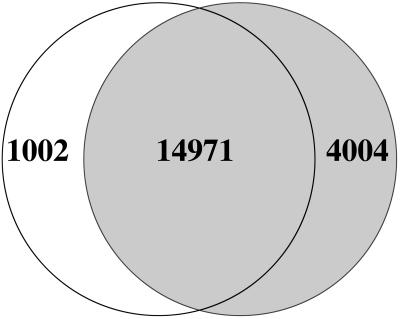
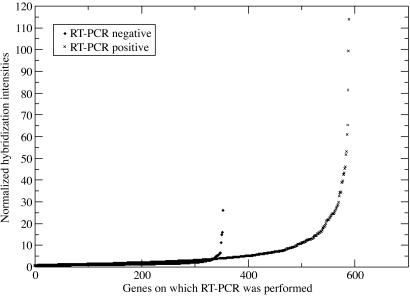
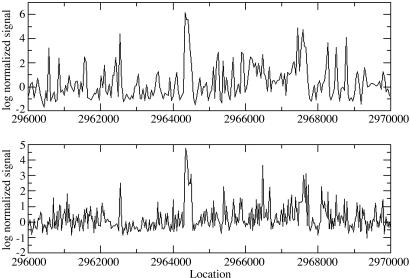
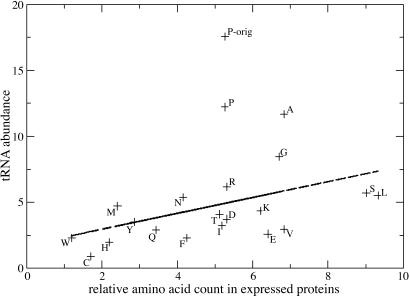
Using a maskless photolithography method, we produced DNA oligonucleotide microarrays with probe sequences tiled throughout the genome of the plant Arabidopsis thaliana. RNA expression was determined for the complete nuclear, mitochondrial, and chloroplast genomes by tiling 5 million 36-mer probes. These probes were hybridized to labeled mRNA isolated from liquid grown T87 cells, an undifferentiated Arabidopsis cell culture line. Transcripts were detected from at least 60% of the nearly 26,330 annotated genes, which included 151 predicted genes that were not identified previously by a similar genome-wide hybridization study on four different cell lines. In comparison with previously published results with 25-mer tiling arrays produced by chromium masking-based photolithography technique, 36-mer oligonucleotide probes were found to be more useful in identifying intron-exon boundaries. Using two-dimensional HPLC tandem mass spectrometry, a small-scale proteomic analysis was performed with the same cells. A large amount of strongly hybridizing RNA was found in regions "antisense" to known genes. Similarity of antisense activities between the 25-mer and 36-mer data sets suggests that it is a reproducible and inherent property of the experiments. Transcription activities were also detected for many of the intergenic regions and the small RNAs, including tRNA, small nuclear RNA, small nucleolar RNA, and microRNA. Expression of tRNAs correlates with genome-wide amino acid usage.
Figures
References
-
- The Arabidopsis Genome Initiative (2000) Nature 408, 796–815. - PubMed
-
- Grunenfelder, B. & Winzeler, E. A. (2002) Nat. Rev. Genet. 3, 653–661. - PubMed
-
- Velculescu, V. E., Zhang, L., Vogelstein, B. & Kinzler, K. W. (1995) Science 270, 484–487. - PubMed
-
- Hudson, T. J., Stein, L. D., Gerety, S. S., Ma, J., Castle, A. B., Silva, J., Slonim, D. K., Baptista, R., Kruglyak, L., Xu, S. H., et al. (1995) Science 270, 1945–1954. - PubMed
-
- Singh-Gasson, S., Green, R. D., Yue, Y., Nelson, C., Blattner, F., Sussman, M. R. & Cerrina, F. (1999) Nat. Biotechnol. 17, 974–978. - PubMed
Publication types
MeSH terms
Substances
LinkOut - more resources
Full Text Sources
Other Literature Sources
Molecular Biology Databases
Miscellaneous
