. 2005 Jul 1;106(1):287-95.
doi: 10.1182/blood-2004-12-4794. Epub 2005 Mar 8.

NUP98-HOXD13 transgenic mice develop a highly penetrant, severe myelodysplastic syndrome that progresses to acute leukemia

Affiliations

NUP98-HOXD13 transgenic mice develop a highly penetrant, severe myelodysplastic syndrome that progresses to acute leukemia

Ying-Wei Lin et al. Blood. .

Abstract

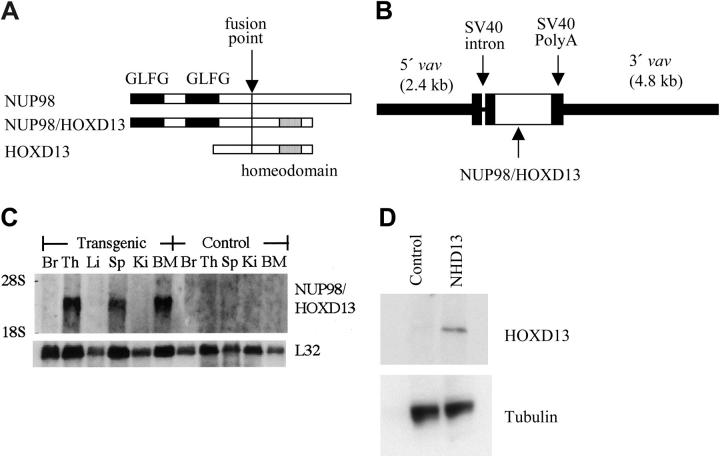
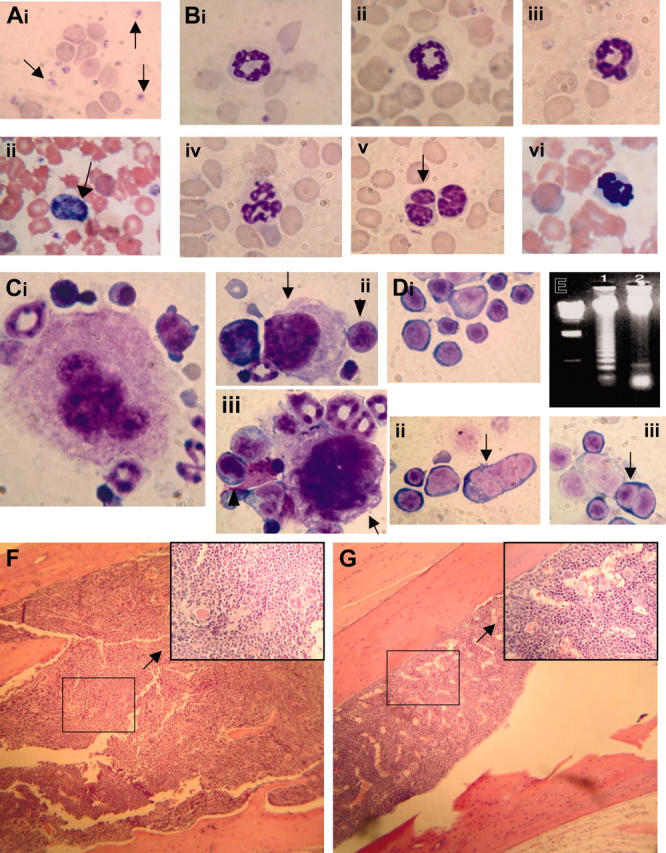
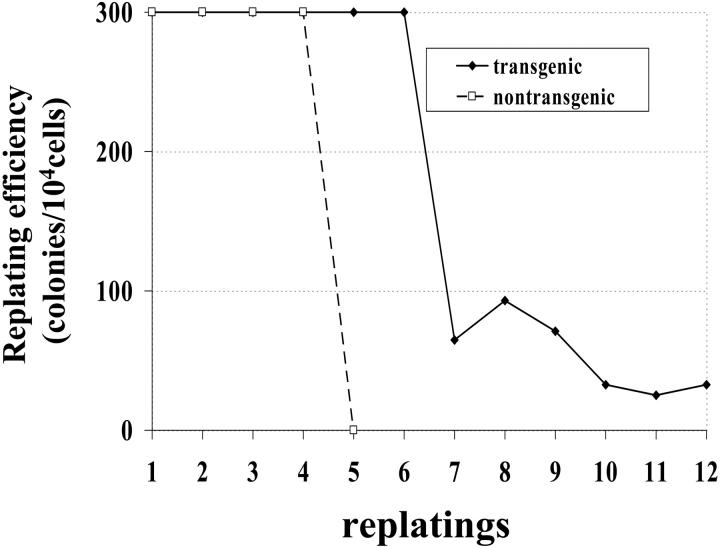
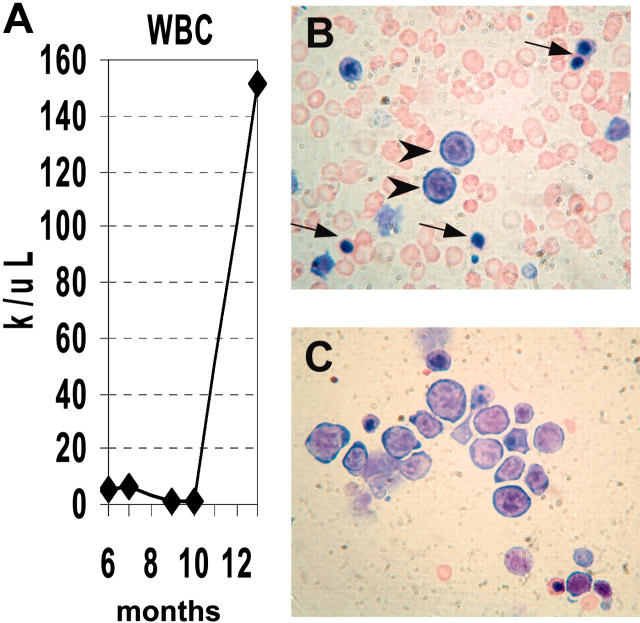
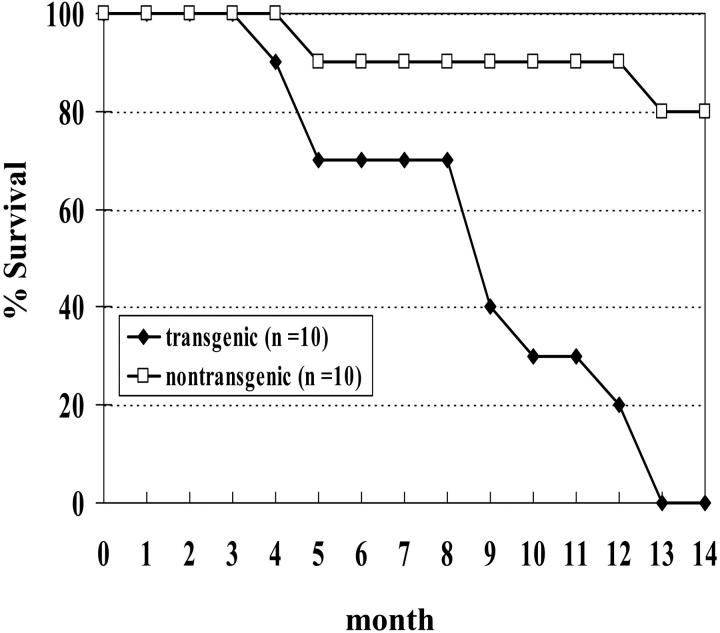
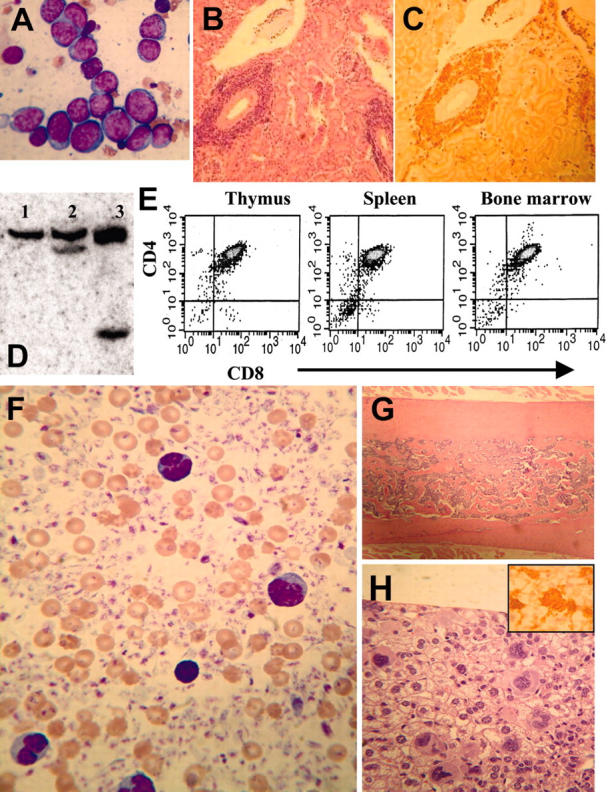
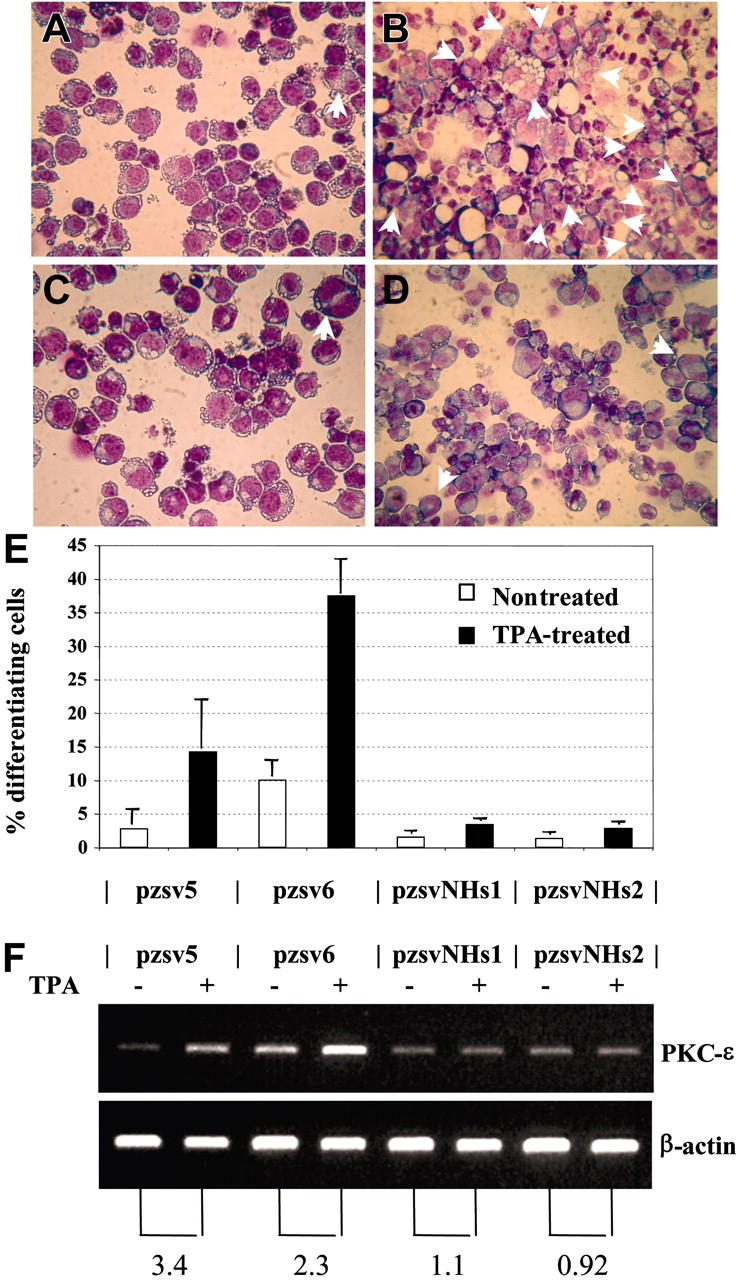
The myelodysplastic syndromes (MDSs) are a group of clonal hematopoietic stem-cell disorders characterized by ineffective hematopoiesis and dysplasia. A wide spectrum of genetic aberrations has been associated with MDS, including chromosomal translocations involving the NUP98 gene. Using a NUP98-HOXD13 fusion gene, we have developed a mouse model that faithfully recapitulates all of the key features of MDS, including peripheral blood cytopenias, bone marrow dysplasia, and apoptosis, and transformation to acute leukemia. The MDS that develops in NUP98-HOXD13 transgenic mice is uniformly fatal. Within 14 months, all of the mice died of either leukemic transformation or severe anemia and leucopenia as a result of progressive MDS. The NUP98-HOXD13 fusion gene inhibits megakaryocytic differentiation and increases apoptosis in the bone marrow, suggesting a mechanism leading to ineffective hematopoiesis in the presence of a hypercellular bone marrow. These mice provide an accurate preclinical model that can be used for the evaluation of MDS therapy and biology.


Figures

Figure 1.
Figure 1.
Generation of NUP98-HOXD13 (NHD13) transgenic mice. (A) Schematic of NHD13 fusion. The fusion point, NUP98 GLFG repeats, and HOXD13 homeodomain are indicated. (B) Construct used for pronuclear injection. The 5′ and 3′ vav regulatory elements, simian virus 40 (SV40) intron and polyadenylation signal, and NHD13 fusion cDNA are indicated. (C) Northern blot analysis of NHD13 expression. (Top) Human NUP98 probe and (bottom) L32 probe (used as an RNA-loading control). Br indicates brain; Th, thymus; Li, liver; Sp, spleen; Ki, kidney; BM, bone marrow. (D) Western blot of lysates from control and NHD13 transgenic thymocytes. A 53 kDa band is seen only in the transgenic thymocytes. The blot was reprobed with tubulin as a loading control.
Figure 2.
Figure 2.
Myelodysplastic syndrome in NHD13 transgenic mice. (Ai) MGG-stained peripheral blood smear from control nontransgenic mouse no. 1094; normal platelets are indicated with an arrow. (ii) MGG-stained peripheral blood from mouse no. 1145 showing a giant platelet (arrow), polychromasia, and poikilocytosis. (B) High-power view of normal (i-ii, mouse no. 1093; iii, mouse no. 1094) and transgenic (iv, mouse no. 1101; v, mouse no. 1103; vi, mouse no. 1145) neutrophils stained with MGG; note hypersegmented neutrophils in iv and vi, and a pseudo-Pelger-Huet anomaly in v. (Ci) A normal megakaryocyte in bone marrow from nontransgenic control mouse (no. 1093). (ii-iii) Dysplastic megakaryocytes (arrows) from NHD13 transgenic mouse (no. 1101) showing hypolobulated nuclei and increased nuclear-cytoplasmic ratio. Erythroblasts with clefted nuclei are also seen, indicated with arrowheads. (Di) Normal erythroid precursors from a control, nontransgenic mouse (no. 1094). (ii-iii) Dysplastic, multinucleated erythroblasts (indicated with arrows) from NHD13 mice (nos. 1101 and 1145). (E) Agarose gel electrophoresis of genomic DNA isolated from transgenic (mouse no. 1103, lane 1) or nontransgenic (mouse no. 1093, lane 2) mouse bone marrow. Size standard (far left lane) is HindIII-digested λ-phage DNA. (F-G) Low-power and (inset) high-power view of H&E-stained bone marrow from NHD13 transgenic (F, mouse no. 1103) and nontransgenic control (G, mouse no. 1094).
Figure 3.
Figure 3.
Increased replating potential of NHD13 bone marrow. Bone marrow was obtained from 1 transgenic (no. 1101) and 1 nontransgenic (no. 1094) mouse. Dishes with more than 300 colonies were scored as 300 colonies.
Figure 4.
Figure 4.
Progression of MDS to acute leukemia. (A) Serial analysis of WBC counts from mouse no. 1018. Note initially normal count, followed by marked leukopenia, terminating with leukocytosis. (B) Peripheral blood showing erythroblasts (arrowheads) and nucleated RBCs (arrows). (C) Bone marrow replaced by erythroblasts, stained with MGG.
Figure 5.
Figure 5.
Survival curve of NHD13 transgenic mice. Mice were observed for 14 months. Two nontransgenic control mice were found dead without signs of acute leukemia.
Figure 6.
Figure 6.
Pre-T (mice nos. 1149 and 1901) or megakaryocytic (mouse no. 1017) leukemia in NHD13 transgenic mice. (A) Bone marrow from mouse no. 1901 infiltrated with lymphoblasts characterized by high nuclear-cytoplasmic ratio, variably condensed nuclear chromatin, and prominent nucleoli, stained with MGG. (B-C) Perivascular infiltration of kidney from mouse no. 1901 with lymphoblasts, stained with H&E (B) or anti-CD3 (C). (D) Genomic DNA from control (lane 1) or pre-T LBL (mice nos. 1149 and 1901, lanes 2-3) mice digested with SstI and hybridized to a T-cell receptor β (TCRβ) probe. Clonal rearrangements are indicated with arrows. (E) Cells from mouse no. 1901 with pre-T LBL (thymus, spleen, and bone marrow) were stained with CD4 and CD8 and analyzed by fluorescence activated cell sorting (FACS). (F) Peripheral blood (from mouse no. 1017) smear showing dramatically increased platelet count, giant platelets, and megakaryoblasts, stained with MGG. (G) Osteosclerotic bone marrow (from mouse no. 1017) stained with H&E. (H) Liver infiltrated with megakaryocytes and megakaryoblasts, stained with H&E (inset, × 400) or anti-CD41.
Figure 7.
Figure 7.
NHD13 inhibits megakaryocytic differentiation. (A-B) Control transfectant pzsv5, untreated (A) or treated (B) with TPA. Multinucleated cells are indicated with arrows. (C-D) Stable transfectant that expresses NHD13 (pzsvNHs1), either untreated (C) or treated (D) with TPA. (E) Percentage of differentiating cells (mean and SD of 3 independent experiments). Pzsv5 and pzsv6 are control transfectants; pzsvNHs1 and pzsvNHs2 are stable NHD13 transfectants. (F) RT-PCR for PKC-ε and β-actin. (Top) PKC-ε, (bottom) β-actin. The numbers below the picture indicate the fold increase of PKC-ε expression normalized to β-actin expression.

References

    1. Mufti G, List AF, Gore SD, Ho AY. Myelodysplastic syndrome. Hematology (Am Soc Hematol Educ Program). 2003: 176-199. - PubMed
    1. Kurzrock R. Myelodysplastic syndrome overview. Semin Hematol. 2002;39: 18-25. - PubMed
    1. Steensma DP, Tefferi A. The myelodysplastic syndrome(s): a perspective and review highlighting current controversies. Leuk Res. 2003;27: 95-120. - PubMed
    1. Slape C, Aplan PD. The role of NUP98 gene fusions in hematologic malignancy. Leuk Lymphoma. 2004;45: 1341-1350. - PubMed
    1. Nakamura T, Largaespada DA, Shaughnessy JD Jr, Jenkins NA, Copeland NG. Cooperative activation of Hoxa and Pbx1-related genes in murine myeloid leukaemias. Nat Genet. 1996;12: 149-153. - PubMed

MeSH terms