

Molecular mechanisms in uterine epithelium during trophoblast binding: the role of small GTPase RhoA in human uterine Ishikawa cells
- PMID: 15757515
- PMCID: PMC1079928
- DOI: 10.1186/1743-1050-2-4
Molecular mechanisms in uterine epithelium during trophoblast binding: the role of small GTPase RhoA in human uterine Ishikawa cells
Abstract
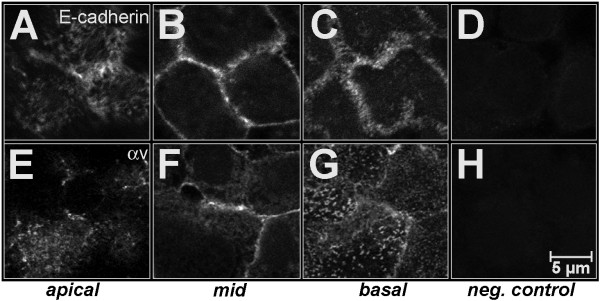
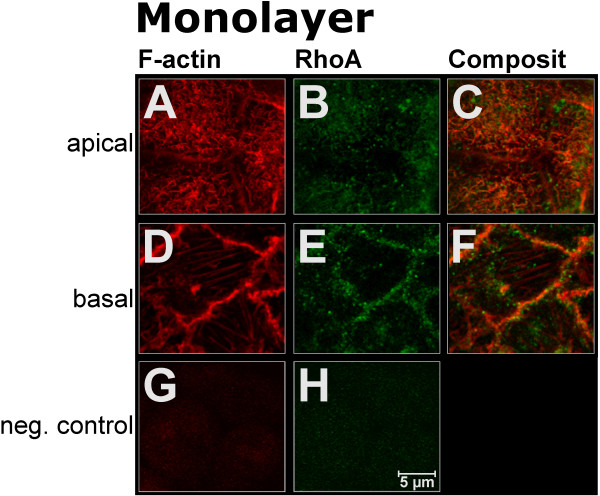
BACKGROUND: Embryo implantation requires that uterine epithelium develops competence to bind trophoblast to its apical (free) poles. This essential element of uterine receptivity seems to depend on a destabilisation of the apico-basal polarity of endometrial epithelium. Accordingly, a reorganisation of the actin cytoskeleton regulated by the small GTPase RhoA plays an important role in human uterine epithelial RL95-2 cells for binding of human trophoblastoid JAR cells. We now obtained new insight into trophoblast binding using human uterine epithelial Ishikawa cells. METHODS: Polarity of Ishikawa cells was investigated by electron microscopy, apical adhesiveness was tested by adhesion assay. Analyses of subcellular distribution of filamentous actin (F-actin) and RhoA in apical and basal cell poles were performed by confocal laser scanning microscopy (CLSM) with and without binding of JAR spheroids as well as with and without inhibition of small Rho GTPases by Clostridium difficile toxin A (toxin A). In the latter case, subcellular distribution of RhoA was additionally investigated by Western blotting. RESULTS: Ishikawa cells express apical adhesiveness for JAR spheroids and moderate apico-basal polarity. Without contact to JAR spheroids, significantly higher signalling intensities of F-actin and RhoA were found at the basal as compared to the apical poles in Ishikawa cells. RhoA was equally distributed between the membrane fraction and the cytosol fraction. Levels of F-actin and RhoA signals became equalised in the apical and basal regions upon contact to JAR spheroids. After inhibition of Rho GTPases, Ishikawa cells remained adhesive for JAR spheroids, the gradient of fluorescence signals of F-actin and RhoA was maintained while the amount of RhoA was reduced in the cytosolic fraction with a comparable increase in the membrane fraction. CONCLUSION: Ishikawa cells respond to JAR contact as well as to treatment with toxin A with rearrangement of F-actin and small GTPase RhoA but seem to be able to modify signalling pathways in a way not elucidated so far in endometrial cells. This ability may be linked to the degree of polar organisation observed in Ishikawa cells indicating an essential role of cell phenotype modification in apical adhesiveness of uterine epithelium for trophoblast in vivo.
Figures


Similar articles
-
Human uterine epithelial RL95-2 cells reorganize their cytoplasmic architecture with respect to Rho protein and F-actin in response to trophoblast binding.Cells Tissues Organs. 2003;175(1):1-8. doi: 10.1159/000073432. Cells Tissues Organs. 2003. PMID: 14605490
-
Adhesiveness of human uterine epithelial RL95-2 cells to trophoblast: rho protein regulation.Mol Hum Reprod. 2002 Nov;8(11):1014-22. doi: 10.1093/molehr/8.11.1014. Mol Hum Reprod. 2002. PMID: 12397214
-
In vitro studies on endometrial adhesiveness for trophoblast: cellular dynamics in uterine epithelial cells.Cells Tissues Organs. 2002;172(3):237-52. doi: 10.1159/000066963. Cells Tissues Organs. 2002. PMID: 12476051 Review.
-
Cell adhesion to the apical pole of epithelium: a function of cell polarity.Eur J Cell Biol. 1995 Feb;66(2):180-91. Eur J Cell Biol. 1995. PMID: 7774604
-
Experimental modulation of cell-cell adhesion, invasiveness and differentiation in trophoblast cells.Cells Tissues Organs. 2002;172(3):218-36. doi: 10.1159/000066965. Cells Tissues Organs. 2002. PMID: 12476050 Review.
Cited by
-
In vitro effects of heparin-binding epidermal growth factor on adhesion stage of implantation.Rom J Morphol Embryol. 2023 Oct-Dec;64(4):493-500. doi: 10.47162/RJME.64.4.05. Rom J Morphol Embryol. 2023. PMID: 38184829 Free PMC article.
-
Changes in Epithelial Cell Polarity and Adhesion Guide Human Endometrial Receptivity: How In Vitro Systems Help to Untangle Mechanistic Details.Biomolecules. 2025 Jul 22;15(8):1057. doi: 10.3390/biom15081057. Biomolecules. 2025. PMID: 40867502 Free PMC article. Review.
-
An Assessment of the Mechanophysical and Hormonal Impact on Human Endometrial Epithelium Mechanics and Receptivity.Int J Mol Sci. 2024 Mar 27;25(7):3726. doi: 10.3390/ijms25073726. Int J Mol Sci. 2024. PMID: 38612536 Free PMC article.
-
Stiff Extracellular Matrix Promotes Invasive Behaviors of Trophoblast Cells.Bioengineering (Basel). 2023 Mar 21;10(3):384. doi: 10.3390/bioengineering10030384. Bioengineering (Basel). 2023. PMID: 36978775 Free PMC article.
-
Characterization of the role for cadherin 6 in the regulation of human endometrial receptivity.Reprod Biol Endocrinol. 2020 Jun 29;18(1):66. doi: 10.1186/s12958-020-00624-w. Reprod Biol Endocrinol. 2020. PMID: 32600462 Free PMC article.
References
-
- Denker HW. Endometrial receptivity: cell biological aspects of an unusual epithelium. A review. Anat Anz. 1994;176:53–60. - PubMed
-
- Denker HW, Thie M. The regulatory function of the uterine epithelium for trophoblast attachment: experimental approaches. Ital J Anat Embryol. 2001;106:291–306. - PubMed
-
- Albers A, Thie M, Hohn HP, Denker HW. Differential expression and localization of integrins and CD44 in the membrane domains of human uterine epithelial cells during the menstrual cycle. Acta Anat. 1995;153:12–19. - PubMed
LinkOut - more resources
Full Text Sources