Rapid identification of emerging pathogens: coronavirus
- PMID: 15757550
- PMCID: PMC3298233
- DOI: 10.3201/eid1103.040629
Rapid identification of emerging pathogens: coronavirus
Abstract
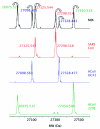
We describe a new approach for infectious disease surveillance that facilitates rapid identification of known and emerging pathogens. The process uses broad-range polymerase chain reaction (PCR) to amplify nucleic acid targets from large groupings of organisms, electrospray ionization mass spectrometry for accurate mass measurements of PCR products, and base composition signature analysis to identify organisms in a sample. We demonstrate this principle by using 14 isolates of 9 diverse Coronavirus spp., including the severe acute respiratory syndrome-associated coronavirus (SARS-CoV). We show that this method could identify and distinguish between SARS and other known CoV, including the human CoV 229E and OC43, individually and in a mixture of all 3 human viruses. The sensitivity of detection, measured by using titered SARS-CoV spiked into human serum, was approximate, equals1 PFU/mL. This approach, applicable to the surveillance of bacterial, viral, fungal, or protozoal pathogens, is capable of automated analysis of >900 PCR reactions per day.
Figures


Similar articles
-
Rapid identification of emerging infectious agents using PCR and electrospray ionization mass spectrometry.Ann N Y Acad Sci. 2007 Apr;1102(1):109-20. doi: 10.1196/annals.1408.008. Ann N Y Acad Sci. 2007. PMID: 17470915 Free PMC article. Review.
-
Viral load quantitation of SARS-coronavirus RNA using a one-step real-time RT-PCR.Int J Infect Dis. 2006 Jan;10(1):32-7. doi: 10.1016/j.ijid.2005.02.003. Epub 2005 Jul 14. Int J Infect Dis. 2006. PMID: 16023880 Free PMC article.
-
Detection of a virus related to betacoronaviruses in Italian greater horseshoe bats.Epidemiol Infect. 2011 Feb;139(2):216-9. doi: 10.1017/S0950268810001147. Epub 2010 May 18. Epidemiol Infect. 2011. PMID: 20478089
-
Coronaviruses: emerging and re-emerging pathogens in humans and animals.Virol J. 2015 Dec 22;12:209. doi: 10.1186/s12985-015-0432-z. Virol J. 2015. PMID: 26690088 Free PMC article.
-
PCR-electrospray ionization mass spectrometry: the potential to change infectious disease diagnostics in clinical and public health laboratories.J Mol Diagn. 2012 Jul;14(4):295-304. doi: 10.1016/j.jmoldx.2012.02.005. Epub 2012 May 11. J Mol Diagn. 2012. PMID: 22584138 Free PMC article. Review.
Cited by
-
Microarray-in-a-tube for detection of multiple viruses.Clin Chem. 2007 Feb;53(2):188-94. doi: 10.1373/clinchem.2006.071720. Epub 2006 Dec 7. Clin Chem. 2007. PMID: 17158198 Free PMC article.
-
Generic detection of coronaviruses and differentiation at the prototype strain level by reverse transcription-PCR and nonfluorescent low-density microarray.J Clin Microbiol. 2007 Mar;45(3):1049-52. doi: 10.1128/JCM.02426-06. Epub 2007 Jan 17. J Clin Microbiol. 2007. PMID: 17229859 Free PMC article.
-
Biosensors and rapid diagnostic tests on the frontier between analytical and clinical chemistry for biomolecular diagnosis of dengue disease: a review.Anal Chim Acta. 2011 Feb 14;687(1):28-42. doi: 10.1016/j.aca.2010.12.011. Epub 2010 Dec 15. Anal Chim Acta. 2011. PMID: 21241843 Free PMC article. Review.
-
Advances in mass spectrometry for the identification of pathogens.Mass Spectrom Rev. 2011 Nov-Dec;30(6):1203-24. doi: 10.1002/mas.20320. Epub 2011 May 9. Mass Spectrom Rev. 2011. PMID: 21557290 Free PMC article. Review.
-
A simplified and standardized polymerase chain reaction format for the diagnosis of leishmaniasis.J Infect Dis. 2008 Nov 15;198(10):1565-72. doi: 10.1086/592509. J Infect Dis. 2008. PMID: 18816188 Free PMC article.
References
Publication types
MeSH terms
Substances
Grants and funding
LinkOut - more resources
Full Text Sources
Other Literature Sources
Miscellaneous
