. 2005 May;16(5):2503-17.
doi: 10.1091/mbc.e04-11-0968. Epub 2005 Mar 9.

Homeostatic adjustment and metabolic remodeling in glucose-limited yeast cultures

Affiliations

Homeostatic adjustment and metabolic remodeling in glucose-limited yeast cultures

Matthew J Brauer et al. Mol Biol Cell. 2005 May.

Abstract

We studied the physiological response to glucose limitation in batch and steady-state (chemostat) cultures of Saccharomyces cerevisiae by following global patterns of gene expression. Glucose-limited batch cultures of yeast go through two sequential exponential growth phases, beginning with a largely fermentative phase, followed by an essentially completely aerobic use of residual glucose and evolved ethanol. Judging from the patterns of gene expression, the state of the cells growing at steady state in glucose-limited chemostats corresponds most closely with the state of cells in batch cultures just before they undergo this "diauxic shift." Essentially the same pattern was found between chemostats having a fivefold difference in steady-state growth rate (the lower rate approximating that of the second phase respiratory growth rate in batch cultures). Although in both cases the cells in the chemostat consumed most of the glucose, in neither case did they seem to be metabolizing it primarily through respiration. Although there was some indication of a modest oxidative stress response, the chemostat cultures did not exhibit the massive environmental stress response associated with starvation that also is observed, at least in part, during the diauxic shift in batch cultures. We conclude that despite the theoretical possibility of a switch to fully aerobic metabolism of glucose in the chemostat under conditions of glucose scarcity, homeostatic mechanisms are able to carry out metabolic adjustment as if fermentation of the glucose is the preferred option until the glucose is entirely depleted. These results suggest that some aspect of actual starvation, possibly a component of the stress response, may be required for triggering the metabolic remodeling associated with the diauxic shift.


Figures

Figure 1.
Figure 1.
Culture characteristics across the diauxic shift. (A) Cell density (measured by scattering at 600 nm and by Coulter particle count) is plotted on a logarithmic scale versus the time at which the sample was harvested. The exponential parameters for each phase of growth were calculated by fitting an exponential curve to the data and are represented by solid lines. From optical density measurements, the parameter r = 0.4211 (R2 = 0.996) for exponential growth before the diauxic shift and r = 0.0646 (R2 = 0.8828) for exponential growth after the diauxic shift. From particle count measurements before the diauxic shift, r = 0.4342 (R2 = 0.982). Subsequent to the diauxic shift, r = 0.0354 (R2 = 0.8608). The chemostat growth rate corresponding to r = 0.25 is shown for comparison as a dotted line tangent to each growth curve. The vertical dotted line marks the point in the culture at which the glucose becomes exhausted. Open and closed symbols represent data taken from different culture replicates. (B) Culture density and residual glucose and ethanol concentrations. Arrows indicate time points at which the culture was sampled for gene expression, and horizontal lines show residual glucose concentrations in chemostat cultures with different dilution rates (D = 0.05, D = 0.25).
Figure 2.
Figure 2.
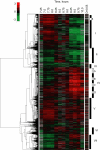
Global gene expression across the diauxic shift. Gene expression values are log2 of the ratio of batch culture to chemostat (D = 0.25) culture expression. Hierarchical clustering by gene was done for expression in the batch time points (columns headed with the time of harvest). Data from the low dilution rate chemostat were subsequently added (column labeled D = 0.05). Clusters identified for subsequent analysis are shown with vertical bars. In several instances groups of genes with transient expression are shown with a white bar and labeled A–E.
Figure 3.
Figure 3.
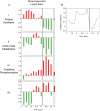
Composite gene expression of clusters I, II, IV, and VII. (A) Mean expression of each cluster. (B) Mean deviation of batch expression from the high dilution rate (D = 0.25) chemostat. Values for low dilution-rate (D = 0.05) chemostat are given in columns marked with an asterisk (*).
Figure 4.
Figure 4.
Expression of individual genes related to the fermentative and respiratory pathways. Gene expression profiles in Figures 4, 5, 6 are from the second batch culture. Data are uncentered and relative to the expression of the chemostat (D = 0.25) reference culture. Data for the low dilution rate (D = 0.5) chemostat are shown, when available, in the column marked with an asterisk (*). (A) Genes involved in the direction of carbon flux toward fermentation are coordinately expressed over the course of the diauxic shift. (B) Genes involved in the TCA and glyoxylate cycles become highly expressed after glucose depletion. Genes shown are FUM1, SDH1-4, MDH1, MDH3, CIT1-2, ACO1, KGD1-2, LPD1, and IDH1-2. For clarity, only the genes showing most (CIT2) and least extreme changes (LPD1) are labeled. (C) Inferred effect of gene expression changes is to direct carbon metabolic flux from the fermentative into the respiratory pathway. Qualitative changes in gene expression are given by the color of the gene labels (red for increase and green for decrease) and by the thickness of the line describing the step in the pathway.
Figure 5.
Figure 5.
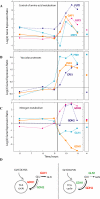
Expression of individual genes related to nitrogen use and amino acid metabolism. (A) Amino acid synthesis and utilization genes. (B) Vacuolar protease genes. (C) Genes involved in directing the flux of carbon into the ammonium assimilation pathway. (D) Inferred effects of expression changes on the ammonium assimilation pathway. Labels are as for Figure 4D.
Figure 6.
Figure 6.
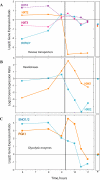
Expression of individual genes related to glycolysis and respiratory metabolism. (A) Genes involved in hexose import. (B) Two hexokinase genes. (C) Genes involved in glycolysis and gluconeogenesis.
Figure 7.
Figure 7.
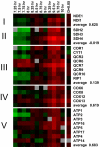
Changes in gene expression for components of the respiratory enzyme complexes. Genes were organized by identity in the mitochondrial oxidative phosphorylation complexes. Complex 1, NADH-dehydrogenase; complex II, succinate dehydrogenase; complex III: cytochrome bc1; complex IV, cytochrome oxidase; and complex V, ATP synthase. Mitochondrial complex identity follows Ohlmeier et al. (2004).
Figure 8.
Figure 8.
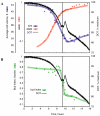
Changes in cell volume, culture density, dissolved oxygen, and bud morphology across the diauxic shift. (A) Culture density and average cell volume as determined by Coulter particle analyzer are plotted across the course of the batch time course. (B) Proportion of cells with microscopically identifiable buds (bud index) plotted across the time course. In both A and B, the dissolved oxygen tension (DOT) is indicated, expressed as percentage of saturation. The vertical dotted line indicates the point at which residual glucose concentration drops below the sensitivity of the assay. Light colored lines were estimated by eye to denote the approximate trends in the data.
Figure 9.
Figure 9.
Model for metabolic changes during the diauxic shift. The cell's response to changes in carbon source availability is composed of two kinds of mechanisms: the continuous metabolic adjustments to declining residual metabolite concentration and the discontinuous remodeling that accompanies a switch between metabolic modes.

References

    1. Adams, J., Paquin, C., Oeller, P. W., and Lee, L. W. (1985). Physiological characterization of adaptive clones in evolving populations of the yeast Saccharomyces cerevisiae. Genetics 110, 173-186. - PMC - PubMed
    1. Alexander, M., and Jeffries, T. (1990). Respiratory efficiency and metabolite partitioning as regulatory phenomena in yeasts. Enzyme Microb. Technol. 12, 2-19.
    1. Boer, V. M., de Winde, J. H., Pronk, J. T., and Piper, M. D. (2003). The genome-wide transcriptional responses of Saccharomyces cerevisiae grown on glucose in aerobic chemostat cultures limited for carbon, nitrogen, phosphorus, or sulfur. J. Biol. Chem. 278, 3265-3274. - PubMed
    1. Boy-Marcotte, E., Perrot, M., Bussereau, F., Boucherie, H., and Jacquet, M. (1998). Msn2p and Msn4p control a large number of genes induced at the diauxic transition which are repressed by cyclic AMP in Saccharomyces cerevisiae. J. Bacteriol. 180, 1044-1052. - PMC - PubMed
    1. Boy-Marcotte, E., Tadi, D., Perrot, M., Boucherie, H., and Jacquet, M. (1996). High cAMP levels antagonize the reprogramming of gene expression that occurs at the diauxic shift in Saccharomyces cerevisiae. Microbiology 142, 459-467. - PubMed

Publication types

MeSH terms