Comparative Study
. 2005 Mar 9;25(10):2447-54.
doi: 10.1523/JNEUROSCI.4696-04.2005.

Signaling within the master clock of the brain: localized activation of mitogen-activated protein kinase by gastrin-releasing peptide

Affiliations
Comparative Study

Signaling within the master clock of the brain: localized activation of mitogen-activated protein kinase by gastrin-releasing peptide

Michael C Antle et al. J Neurosci. .

Abstract

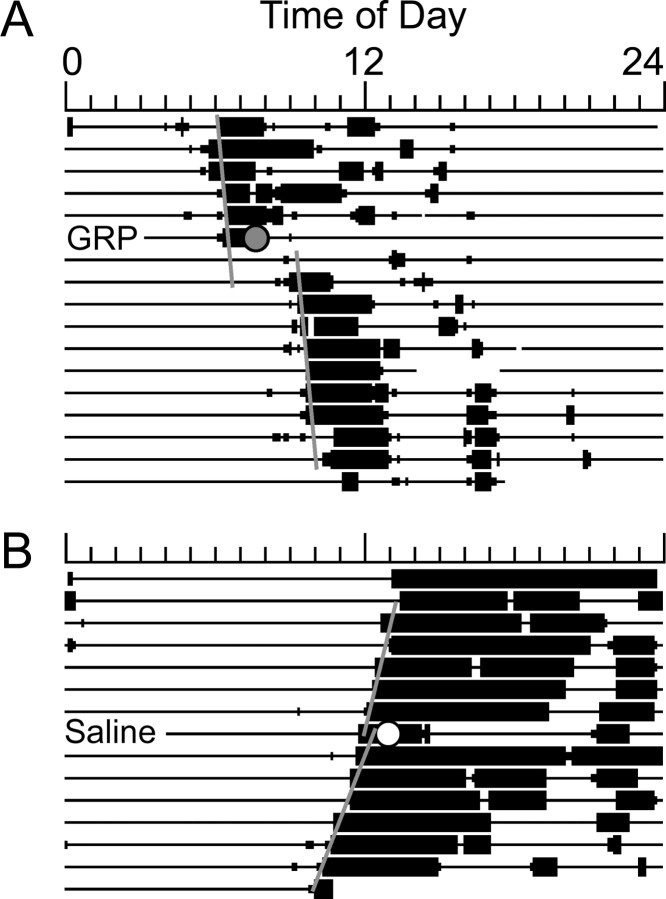
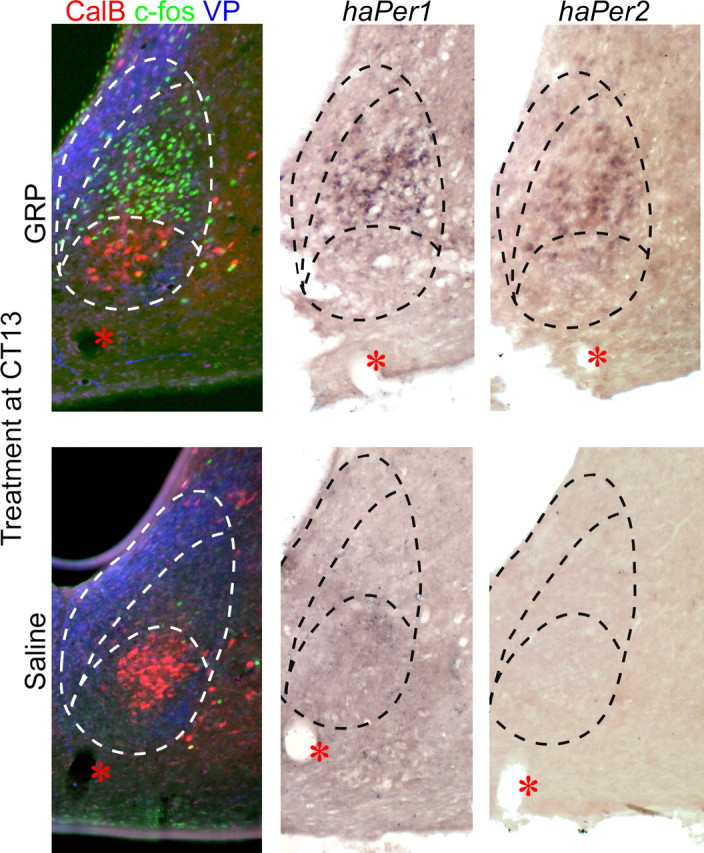
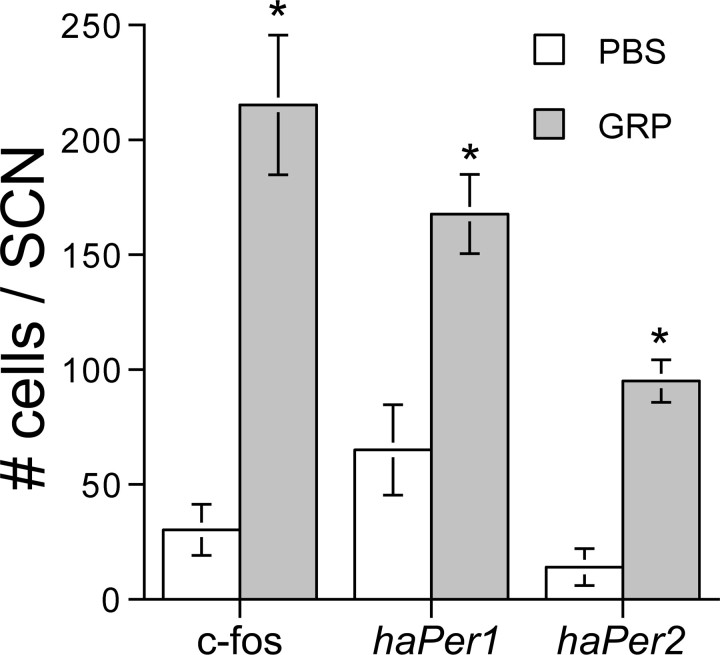
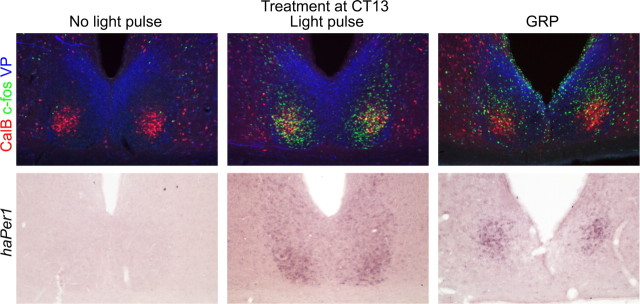
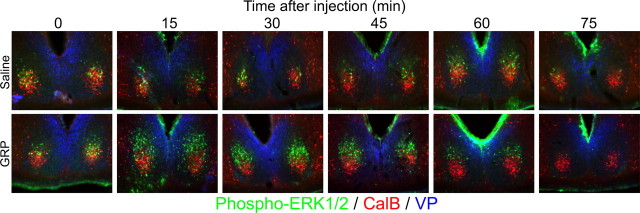
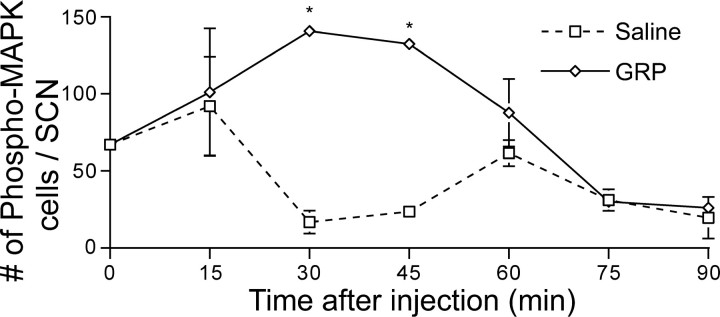
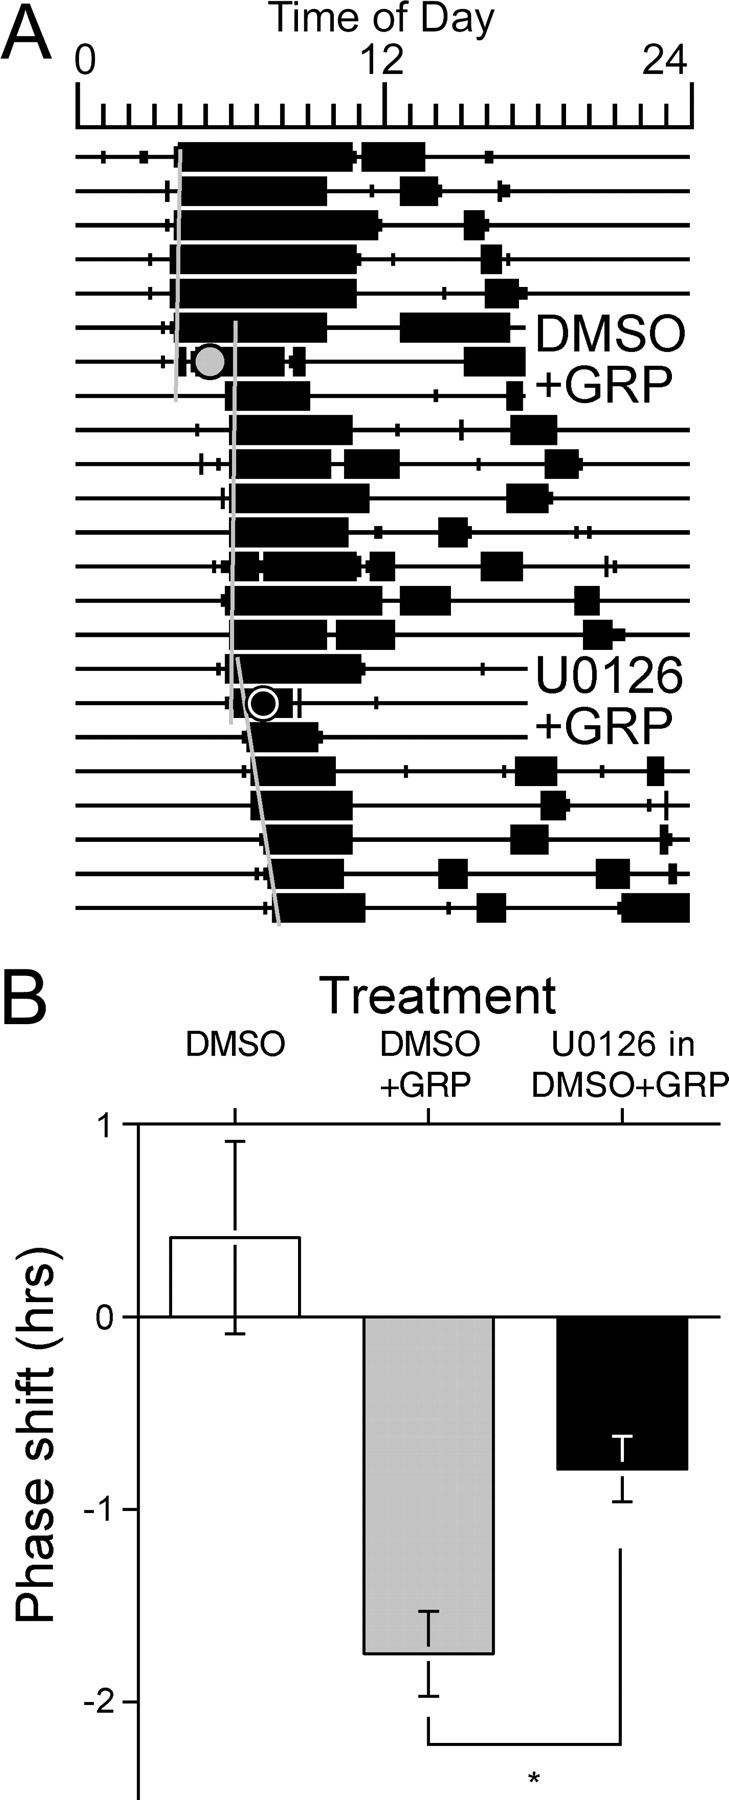
The circadian clock located in the mammalian suprachiasmatic nucleus (SCN) exhibits substantial heterogeneity in both its neurochemical and functional organization, with retinal input and oscillatory timekeeping functions segregated to different regions within the nucleus. Although it is clear that photic information must be relayed from directly retinorecipient cells to the population of oscillator cells within the nucleus, the intra-SCN signal (or signals) underlying such communication has yet to be identified. Gastrin-releasing peptide (GRP), which is found within calbindin-containing retinorecipient cells and causes photic-like phase shifts when applied directly to the SCN, is a candidate molecule. Here we examine the effect of GRP on both molecular and behavioral properties of the hamster circadian system. Within 30 min a third ventricle injection of GRP produces an increase in the number of cells expressing the phosphorylated form of extracellular signal-regulated kinases 1/2 (p-ERK1/2), localized in a discrete group of SCN cells that form a cap dorsal to calbindin cells and lateral to vasopressin cells. At 1 h after the peak of p-ERK expression these cap cells express c-fos, Period1, and Period2. Pharmacological blockade of ERK phosphorylation attenuates phase shifts to GRP. These data indicate that GRP is an output signal of retinorecipient SCN cells and activates a small cluster of SCN neurons. This novel cell group likely serves as a relay or integration point for communicating photic phase-resetting information to the rhythmic cells of the SCN. These findings represent a first step in deconstructing the SCN network constituting the brain clock.


Figures

Figure 1.
Figure 1.
Sample actograms from animals housed in constant darkness depicting typical phase shifts that follow an anterior third ventricle injection of either 5 μl of 100 pmol/μl GRP (A) or 5 μl of saline (B) 1 h after activity onset (i.e., CT13).
Figure 2.
Figure 2.
Sample SCN photomicrographs from animals given an injection of either GRP (5 μl of 100 pmol/μl; top row) or saline (5 μl; bottom row) to the anterior third ventricle 1 h after activity onset (i.e., CT13) and perfused 90 min later (i.e., CT14.5). Each row represents three adjacent sections from the same animal processed for triple-labeled ICC (red, CalB; green, c-fos; blue, VP), haPer1 DiG ISH, and haPer2 DiG ISH, respectively. Dashed black and white lines represent the borders of the SCN and of the CalB and VP immunoreactivity defined in the first column. Given that the templates were defined in an adjacent section, the dashed black lines on the in situ hybridization photomicrographs represent a best estimate of regional boundaries in that section. The red asterisk indicates the location of a blood vessel found in all three adjacent sections.
Figure 3.
Figure 3.
Bar graph representing the mean ± SEM of cell counts expressing c-fos, haPer1, or haPer2 after an injection of either GRP (5 μl of 100 pmol/μl) or saline (5 μl) to the anterior third ventricle 1 h after activity onset (i.e., CT13) and perfused 90 min later (i.e., CT14.5). The asterisk indicates a significant difference in the number of cells compared with the saline control (independent t tests; p < 0.01).
Figure 4.
Figure 4.
Sample SCN photomicrographs from an untreated animal (first column), an animal exposed to a 30 min, 2100 lux light pulse at CT13 (second column), and an animal given an injection of GRP (5 μl of 100 pmol/μl) at CT13. All animals were perfused at CT14.5. Each column represents adjacent sections from the same animal processed either for triple-labeled immunocytochemistry (top row; red, CalB; green, c-fos; blue, VP) or for haPer1 DiG ISH (bottom row). Little c-fos or haPer1 expression is observed in the control animal. After a light pulse, the expression of both c-fos and haPer1 is observed in the CalB subregion as well as in the dorsolateral SCN. Most CalB cells in these light-treated animals appeared to contain c-fos. After a GRP injection, the expression of both c-fos and haPer1 is observed in the SCN, primarily in cells dorsal to the CalB region and lateral to the VP region. Little GRP-induced c-fos expression is observed in the CalB region.
Figure 5.
Figure 5.
Photomicrographs triple-labeled for CalB (red), p-ERK (green), and VP (blue) depicting the spatial and temporal expression pattern of p-ERK in the SCN after injections of either saline (5 μl; top row) or GRP (5 μl of 100 pmol/μl; bottom row). Animals were given an injection to the anterior third ventricle at CT13 and were perfused 0, 15, 30, 45, 60, or 75 min later.
Figure 6.
Figure 6.
Quantification of p-ERK expression (mean ± SEM number of cells) in the SCN after injections of either saline (5 μl) or GRP (5 μl of 100 pmol/μl). Animals were given an injection to the anterior third ventricle at CT13 and were perfused 0, 15, 30, 45, 60, 75, or 90 min later. The asterisk indicates a significant difference in the number of cells compared with the saline-treated control (Tukey's HSD; p < 0.05).
Figure 7.
Figure 7.
A, Sample actogram from an animal receiving a CT13 third ventricle injection of GRP (5 μl of 100 pmol/μl) after CT12.5 pretreatment with either DMSO vehicle control (5 μl of 50% DMSO) or the MEK inhibitor U0126 (25 nmol in 5 μl of 50% DMSO). B, Bar graph representing the mean ± SEM phase shifts resulting from the following treatment: DMSO alone at CT12.5; DMSO at CT12.5 followed by GRP at CT13; and U0126 in DMSO at CT12.5 followed by GRP at CT13. The asterisk indicates a significant attenuation of the phase shift compared with the DMSO plus GRP control treatment (paired t test; p < 0.01).

References

    1. Abe H, Rusak B (1994) Physiological mechanisms regulating photic induction of Fos-like protein in hamster suprachiasmatic nucleus. Neurosci Biobehav Rev 18: 531-536. - PubMed
    1. Abe H, Rusak B, Robertson HA (1991) Photic induction of Fos protein in the suprachiasmatic nucleus is inhibited by the NMDA receptor antagonist MK-801. Neurosci Lett 127: 9-12. - PubMed
    1. Abe H, Rusak B, Robertson HA (1992) NMDA and non-NMDA receptor antagonists inhibit photic induction of Fos protein in the hamster suprachiasmatic nucleus. Brain Res Bull 28: 831-835. - PubMed
    1. Aida R, Moriya T, Araki M, Akiyama M, Wada K, Wada E, Shibata S (2002) Gastrin-releasing peptide mediates photic entrainable signals to dorsal subsets of suprachiasmatic nucleus via induction of Period gene in mice. Mol Pharmacol 61: 26-34. - PubMed
    1. Antle MC, Silver R (2005) Orchestrating time: arrangements of the brain's circadian clock. Trends Neurosci, in press. - PubMed

Publication types

MeSH terms

Substances

LinkOut - more resources