Comparative Study
. 2005 Mar 9;25(10):2537-46.
doi: 10.1523/JNEUROSCI.4794-04.2005.

Microglial expression of the B7 family member B7 homolog 1 confers strong immune inhibition: implications for immune responses and autoimmunity in the CNS

Affiliations
Comparative Study

Microglial expression of the B7 family member B7 homolog 1 confers strong immune inhibition: implications for immune responses and autoimmunity in the CNS

Tim Magnus et al. J Neurosci. .

Abstract

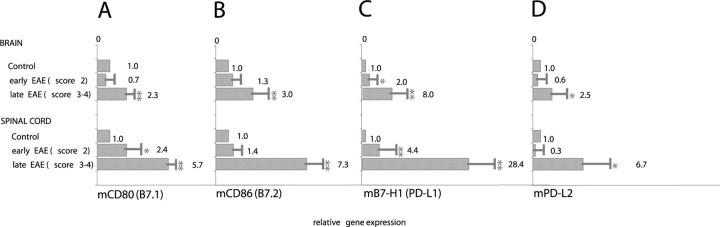
Inflammation of the CNS is usually locally limited to avoid devastating consequences. Critical players involved in this immune regulatory process are the resident immune cells of the brain, the microglia. Interactions between the growing family of B7 costimulatory ligands and their receptors are increasingly recognized as important pathways for costimulation and/or inhibition of immune responses. Human and mouse microglial cells constitutively express B7 homolog 1 (B7-H1) in vitro. However, under inflammatory conditions [presence of interferon-gamma (IFN-gamma) or T-helper 1 supernatants], a significant upregulation of B7-H1 was detectable. Expression levels of B7-H1 protein on microglial cells were substantially higher compared with astrocytes or splenocytes. Coculture experiments of major histocompatibility complex class II-positive antigen-presenting cells (APC) with syngeneic T cells in the presence of antigen demonstrated the functional consequences of B7-H1 expression on T-cell activation. In the presence of a neutralizing anti-B7-H1 antibody, both the production of inflammatory cytokines (IFN-gamma and interleukin-2) and the upregulation of activation markers (inducible costimulatory signal) by T cells were markedly enhanced. Interestingly, this effect was clearly more pronounced when microglial cells were used as APC, compared with astrocytes or splenocytes. Furthermore, B7-H1 was highly upregulated during the course of myelin oligodendrocyte glycoprotein-induced and proteolipid protein-induced experimental allergic encephalomyelitis in vivo. Expression was predominantly localized to areas of strongest inflammation and could be colocalized with microglial cells/macrophages as well as T cells. Together, our data propose microglial B7-H1 as an important immune inhibitory molecule capable of downregulating T-cell activation in the CNS and thus confining immunopathological damage.


Figures

Figure 1.
Figure 1.
Expression and differential modulation of B7 family members and HLA-DR mRNA in human microglial cells and peripheral blood monocytes. Human microglial cells from two different donors [denominated microglia I (HA376) and microglia II (HA382)] were cultured in the absence or presence of Th1 and Th2 supernatants, harvested after 48 h of induction, and analyzed for the expression of the indicated mRNA by QRT-PCR [B7.1 (CD80), B7.2 (CD86), MHC class II (HLA-DR), B7-H1 (PD-L1)]. For comparison, monocytes from two independent donors (monocytes I and II) were processed under the same conditions. Bars and numbers represent the relative gene expression of indicated molecules calculated in relation to unstimulated microglia (set to 1).
Figure 2.
Figure 2.
B7-H1 protein expression in cultured murine microglial cells, astrocytes, and splenocytes. The expression of B7-H1 and MHC class II (HLA-DR) was assessed by flow cytometry in purified and cultured microglial cells, astrocytes, and splenocytes maintained in the absence or presence of IFN-γ (500 U/ml; 48 h). Histograms show staining with the designated antibodies (open) underlaid with the respective isotype controls (filled). The expression analysis was performed with glial cell cultures from five different animal preparations. A representative experiment is shown.
Figure 3.
Figure 3.
mRNA expression of B7 family members in cultured murine microglia and astroglia. Microglia and astrocytes cultured in the absence or presence of IFN-γ (500 U/ml) were harvested after 48 h of induction and analyzed for the expression of the indicated mRNA by QRT-PCR. A, B7.1 (CD80); B, B7.2 (CD86); C, B7-H1 (PD-L1); D, PD-L2. Splenocytes and PHA-stimulated splenocytes were used as controls. Bars and numbers represent the relative gene expression of indicated molecules calculated in relation to unstimulated splenocytes (set to 1). Data represent expression analysis from glial cultures from three different animal preparations (mean ± SEM).
Figure 4.
Figure 4.
Functional consequences of B7-H1 expression for cytokine expression and T-cell activation. A, Polyclonal T cells were cocultured with microglial cells, astrocytes, or splenocytes under syngeneic conditions. T-cell activation was performed by the addition of SEB. To analyze the function of B7-H1, a neutralizing antibody was compared with an isotype control antibody. Supernatants were taken 24 h after coculture, and cytokines released into the supernatant were measured. Bars show the mean ± SD from three independent experiments, each performed in triplicate. B, PPD-specific T cells were cocultured with syngeneic microglial cells in the presence of PPD with either a B7-H1 blocking antibody or an isotype control antibody. Bars show data from three independent experiments, each performed in triplicate. C, PPD-specific T cells were cocultured with syngeneic microglial as shown in B. After 24 h of coculture, cells were separated and examined for expression of ICOS by flow cytometric analysis. The thick black curve refers to the ICOS expression on PPD-specific T cells after B7-H1 neutralization, whereas the dotted gray curve corresponds to the isotype control antibody setting. Results were reproduced three times; a representative example is shown.
Figure 5.
Figure 5.
mRNA expression of B7 family members in the course of EAE. QRT-PCR for B7.1 (CD80) (A), B7.2 (CD86) (B), B7-H1 (PD-L1) (C), and PD-L2 (D) mRNA expression was performed in brain and spinal cord specimens from animals with EAE at different time points after immunization (early EAE, score 2; late EAE, score 3-4). Brain and spinal cord specimens from nonimmunized mice were used as controls. Bars and numbers represent the mean ± SEM of the relative gene expression of indicated molecules calculated in relation to the controls. Three animals of each group were pooled for the analysis (*p < 0.05; **p < 0.01, compared with control).
Figure 6.
Figure 6.
Expression of B7-H1 in the CNS. Fluorescent single or multicolor labeling (top) or enzymatic labeling immunohistochemistry (bottom) in CNS specimens of mice with EAE versus control immunized mice is shown, using antibodies for B7-H1, CD3, MAC3, and GFAP, visualized with secondary fluorochrome reagents (top) or peroxidase (bottom). A-C, B7-H1 (red) is strongly expressed in inflammatory infiltrates (overview in A; higher magnification of a single infiltratein C) but is absent in the control CNS (no expression in E). B and D show DAPI for staining nuclei. F-I, Triple labeling of one section for DAPI (blue, F), CD3 (G, green), and B7-H1 (I, red) shows partial colocalization of CD3 with B7-H1 (H, yellow). Triple labeling of another section for DAPI (K, blue), GFAP (L, green), and B7-H1 (N, red) shows basically no colocalization of B7-H1 with GFAP-positive astrocytes (M, overlay). Serial cerebellar cryostat sections from EAE mice were stained with antibodies for B7-H1 (O, Q) and MAC3 (P, R). Strong but not completely overlapping staining patterns for B7-H1 and MAC3 were observed. O and P show an overview (10×); Q and R show a higher magnification focusing on one infiltrate.
Figure 7.
Figure 7.
Upregulation of B7-H1 expression by CNS-infiltrating macrophages and CNS resident microglia of mice with EAE. A, EAE was induced by subcutaneous immunization with 50 nmol of PLP139-151 in CFA and intravenous injection of 300 ng of pertussis toxin, and disease score was determined as described in Materials and Methods. Clinical disease symptom speaked at day 14 and subsequently declined until day 20 after disease induction. B, CNS cells were isolated from diseased animals at the peak of clinical disease (day 14) and during remission (day 20). B7-H1 expression by CD45high/CD11b+ macrophages (R1) and CD45low/CD11b+ (R2) microglia was determined by flow cytometry. Data are representative of six individual mice. Error bars indicate SEM. B7-H1 expression is higher during remission (t test; *p < 0.02; **p < 0.01).

References

    1. Aloisi F (2001) Immune function of microglia. Glia 36: 165-179. - PubMed
    1. Aloisi F, Penna G, Polazzi E, Minghetti L, Adorini L (1999) CD40-CD154 interaction and IFN-gamma are required for IL-12 but not prosta-glandin E2 secretion by microglia during antigen presentation to Th1 cells. J Immunol 162: 1384-1391. - PubMed
    1. Barker CF, Billingham RE (1977) Immunologically privileged sites. Adv Immunol 25: 1-54. - PubMed
    1. Becher B, Antel JP (1996) Comparison of phenotypic and functional properties of immediately ex vivo and cultured human adult microglia. Glia 18: 1-10. - PubMed
    1. Becher B, Prat A, Antel JP (2000) Brain-immune connection: immunoregulatory properties of CNS-resident cells. Glia 29: 293-304. - PubMed

Publication types

MeSH terms