Comparative Study
. 2005 Mar 9;25(10):2597-608.
doi: 10.1523/JNEUROSCI.3808-04.2005.

Statistics of decision making in the leech

Affiliations
Comparative Study

Statistics of decision making in the leech

Elizabeth Garcia-Perez et al. J Neurosci. .

Abstract

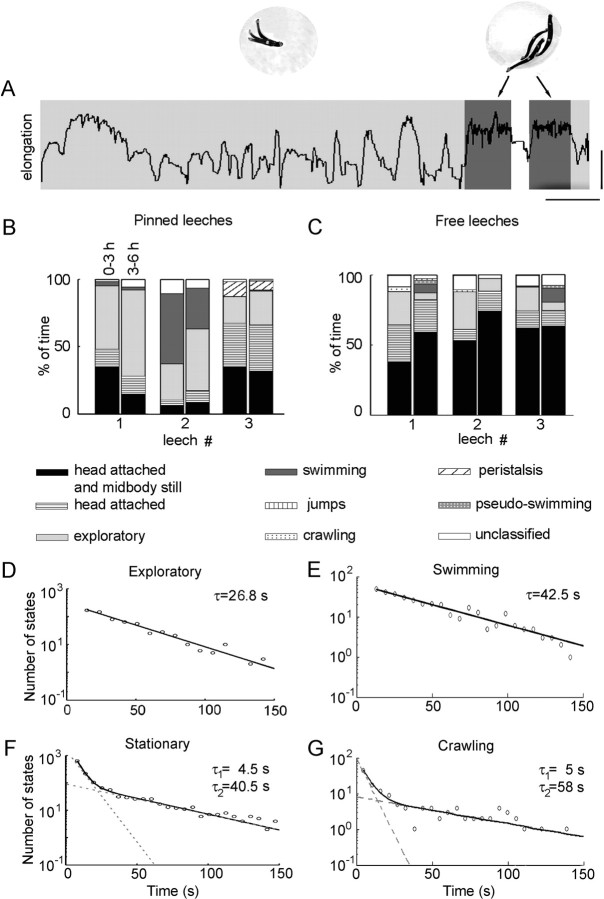
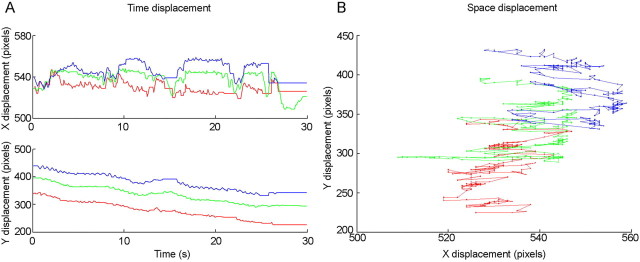
Animals continuously decide among different behaviors, but, even in invertebrates, the mechanisms underlying choice and decision are unknown. In this article, leech spontaneous behavior was tracked and quantified for up to 12 h. We obtained a statistical characterization, in space and time domains, of the decision processes underlying selection of behavior in the leech. We found that the spatial distribution of leech position in a uniform environment is isotropic (the same in all directions), but this isotropy is broken in the presence of localized external stimuli. In the time domain, transitions among behaviors can be described by a Markov process, the structure of which (allowed states and transitions) is highly conserved across individuals. Finally, a wide range of recurrent, deterministic motifs was identified in the apparently irregular and unstructured exploratory behavior. These results provide a rigorous description of the inner dynamics that control the spontaneous and continuous flow of behavioral decisions in the leech.


Figures

Figure 2.
Figure 2.
Analysis of stationary states. A, Displacement of a restrained leech (the position of the pin is marked with a black circle). The trajectories of the head, midbody, and tail, shown in red, green, and blue, respectively, show that the leech uniformly explores the surface of the dish. The inset shows a scheme of the restrained leech preparation. B, Polar plot distribution of stationary states of four different restrained leeches (different color for each leech). The polar plot represents the number of stationary states for every direction, and the magenta circle shows that the distribution of stationary states does not have any statistically privileged direction (p > 0.05). C, As in B, but for a freely moving leech in a square dish. Scale bars, 3.5 cm. D, Polar plot distribution of stationary states of four freely moving leeches, which also demonstrates the spatial uniformity of exploration (p > 0.05). E, F, Superimposed plots of the auto-correlation of ρ and θ, respectively, for stationary states (black) and of the same series scrambled (gray). Black traces show a small but significant bump flanking the central peak, with a width corresponding to 5-10 successive states. G, Width of the auto correlation central peaks for seven pinned (left) and seven free (right) leeches, representing the mean number of significantly correlated successive states for ρ (black) and θ (white). The horizontal dotted line indicates the central spike expected even in the absence of any correlation.
Figure 4.
Figure 4.
Spectral analysis for exploratory states. A, Superposition of four smoothed power spectrums for e(n) during four episodes (lasting 100 s each) of exploratory behavior observed in different leeches. The black line represents the 1/fS fit to one of the power spectra. The slope S is indicated. B, As in A, but for four free leeches. C, Distribution of the power spectrum slope S during exploratory episodes observed in 54 leeches, 27 pinned (in red) and 27 free (in blue). D, Polar plot distribution of the position of the leech during exploratory states observed in five free leeches. Confidence interval is shown in magenta. E, Maximum speed distribution during exploratory behavior (calculated for 10 s) of one leech. This plot is well fit by a Gaussian distribution (black). F, Mean and SD of the Gaussian fits for exploratory speeds of seven pinned leeches and seven free leeches.
Figure 5.
Figure 5.
Analysis of the complex exploratory motion. A, Recurrence plot obtained for 1000 s of exploratory behavior. Dark colors represent similarity or low distance (see Materials and Methods). Patterns of similar behavior repeated in the time series are represented by diagonal line segments (slope of -1), as shown in the inset. B, Original time series (gray) for an exploratory period with some repeated patterns (black) superimposed. Calibration: 50 s, 1.2 cm. C, Some repeated patterns obtained for the time series analyzed in A and B. All of these patterns were absent from the phase-randomized surrogate of the time series. Calibration: 10 s, 2 cm.
Figure 1.
Figure 1.
Behaviors of the leech. A, Elongation e(n) of a freely moving leech tracked over time. Exploratory behaviors are shown in light gray, and swimming behaviors are shown in dark gray. Photos show three superimposed pictures of the leech exploring (left) and three superimposed pictures of the leech swimming (right). Scale bars, 3.5 cm. B, Time distribution of behaviors for three pinned leeches for the first 3 h of recording and for the following 3 h. Behaviors are coded as shown at the bottom of B. C, As in B, but for three free leeches. D-G, Distribution of residence time for exploratory (D; pooled data obtained from 7 leeches), swimming (E; 4 leeches), stationary (F; 11 leeches), and crawling (G; 4 leeches) states. Duration for each distribution is shown in a semilog plot. Continuous lines represent single- and double-exponential fits for distributions; time constants are indicated.
Figure 3.
Figure 3.
Effects of external stimulation. A, C, E, Polar plots with the distribution of the leech body orientations during stationary states in three different experiments using the pinned leech, showing that, in absence of any stimulation, the leech explores the dish uniformly with no preferential direction. B, D, F, Polar plots of three different experiments using pinned leeches, showing the angular distribution of the position of the leech during stationary states in the presence of an external stimulation (light is represented as gray triangles). F, Two (almost opposite) lights were used. Dark gray circles indicate 5% confidence circle for the Poisson distribution of states per sector, as required by an isotropic behavior.
Figure 6.
Figure 6.
Analysis of transitions. A, Transition probabilities between different behaviors observed in one leech. Each row represents the transition probability between a starting state (k, on the left) and the following state (k + 1, on top). Transition probabilities have been calculated for the first half (black) and second half of the experiment (white). Data were collected from a pinned leech preparation lasting 12 h. B, The first panel shows probability of transition for state k + 1 being exploratory if state k was stationary (black) and probability of the same transition conditional on state k - 1 being exploratory (gray). This second two-step probability was always higher, and the overall transition rates were significantly different (*p < 0.05) from the one-step conditional probabilities. The second and third panels show the same analysis but for SLS states (middle) and LLS states (bottom). For SLS states, the conditional probability was always higher, and the overall transition rates were again significantly different (*p < 0.05) from the one-step conditional probabilities. For LLS states, however, the one- and two-step conditional probabilities were not significantly different for four of five experiments (*p < 0.05). C, Top, Two-step transitions to LLS states from exploratory states (black) and from exploratory states after an LLS state (gray). The absence of significant difference (χ2 test for homogeneity of distributions; *p < 0.05) between the one- and two-step conditional probabilities shows that transition probabilities do not depend on the previous behavioral history. Bottom, The same comparison is done for swimming transition probabilities, obtaining the same result (*p < 0.05). Stat, Stationary; Exp, exploratory; Sw, swimming.
Figure 7.
Figure 7.
Hybrid behavior. A, Temporal x and y displacement (top and bottom, respectively) of a hybrid behavior. In this case, the leech shows swimming-like oscillations superimposed on the elongation phase of crawling. Note the difference between both displacement scales. B, Spatial displacement of the same behavior shown in A.
Figure 8.
Figure 8.
Behavior of the leech and transitions among behavioral categories. A, Five behaviors and the transitions between them are shown. Stationary states (LLS) are those with a duration of ≥10 s. The exploratory states included the SLS, with a duration of <10 s. The transitions among behavioral categories are probably controlled by the firing of the command neurons. The known command neurons and their location in the head subesophageal ganglia are shown in B. N1-N4 represent the four neuromeres of the head ganglion.

Similar articles

Cited by

References

    1. Baader AP, Kristan Jr WB (1992) Monitoring neuronal activity during discrete behaviors: a crawling, swimming and shortening device for tethered leeches. J Neurosci Methods 43: 215-223. - PubMed
    1. Barraclough DJ, Conroy ML, Lee D (2004) Prefrontal cortex and decision making in a mixed-strategy game. Nat Neurosci 7: 404-410. - PubMed
    1. Bennett MV (1997) Gap junctions as electrical synapses. J Neurocytol 26: 349-366. - PubMed
    1. Bennett MV (2000) Electrical synapses, a personal perspective (or history). Brain Res Brain Res Rev 32: 16-28. - PubMed
    1. Berg HC (1993) Random walks in biology. Princeton: Princeton UP.

Publication types

LinkOut - more resources