

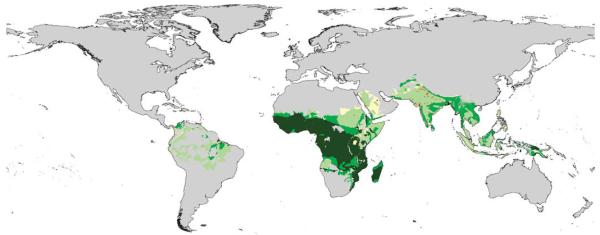
The global distribution of clinical episodes of Plasmodium falciparum malaria
- PMID: 15759000
- PMCID: PMC3128492
- DOI: 10.1038/nature03342
The global distribution of clinical episodes of Plasmodium falciparum malaria
Abstract
Interest in mapping the global distribution of malaria is motivated by a need to define populations at risk for appropriate resource allocation and to provide a robust framework for evaluating its global economic impact. Comparison of older and more recent malaria maps shows how the disease has been geographically restricted, but it remains entrenched in poor areas of the world with climates suitable for transmission. Here we provide an empirical approach to estimating the number of clinical events caused by Plasmodium falciparum worldwide, by using a combination of epidemiological, geographical and demographic data. We estimate that there were 515 (range 300-660) million episodes of clinical P. falciparum malaria in 2002. These global estimates are up to 50% higher than those reported by the World Health Organization (WHO) and 200% higher for areas outside Africa, reflecting the WHO's reliance upon passive national reporting for these countries. Without an informed understanding of the cartography of malaria risk, the global extent of clinical disease caused by P. falciparum will continue to be underestimated.
Figures

Comment in
-
Malaria risk: estimating clinical episodes of malaria.Nature. 2005 Sep 8;437(7056):E3; discussion E4-5. doi: 10.1038/nature04178. Nature. 2005. PMID: 16148888
References
-
- Snow RW, Marsh K, le Sueur D. The need for maps of transmission intensity to guide malaria control in Africa. Parasitol. Today. 1996;12:455–457.
-
- Gallup JL, Sachs JD. The economic burden of malaria. Am. J. Trop. Med. Hyg. 2001;64:85–96. - PubMed
-
- Kiszewski A, et al. A global index representing the stability of malaria transmission. Am. J. Trop. Med. Hyg. 2004;70:486–498. - PubMed
-
- Russell PF. World-wide malaria distribution, prevalence and control. Am. J. Trop. Med. Hyg. 1956;5:937–956. - PubMed
Publication types
MeSH terms
Grants and funding
LinkOut - more resources
Full Text Sources
Other Literature Sources
Medical
