Unbiased descriptor and parameter selection confirms the potential of proteochemometric modelling
- PMID: 15760465
- PMCID: PMC555743
- DOI: 10.1186/1471-2105-6-50
Unbiased descriptor and parameter selection confirms the potential of proteochemometric modelling
Abstract
Background: Proteochemometrics is a new methodology that allows prediction of protein function directly from real interaction measurement data without the need of 3D structure information. Several reported proteochemometric models of ligand-receptor interactions have already yielded significant insights into various forms of bio-molecular interactions. The proteochemometric models are multivariate regression models that predict binding affinity for a particular combination of features of the ligand and protein. Although proteochemometric models have already offered interesting results in various studies, no detailed statistical evaluation of their average predictive power has been performed. In particular, variable subset selection performed to date has always relied on using all available examples, a situation also encountered in microarray gene expression data analysis.
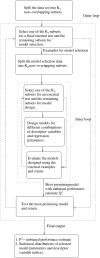
Results: A methodology for an unbiased evaluation of the predictive power of proteochemometric models was implemented and results from applying it to two of the largest proteochemometric data sets yet reported are presented. A double cross-validation loop procedure is used to estimate the expected performance of a given design method. The unbiased performance estimates (P2) obtained for the data sets that we consider confirm that properly designed single proteochemometric models have useful predictive power, but that a standard design based on cross validation may yield models with quite limited performance. The results also show that different commercial software packages employed for the design of proteochemometric models may yield very different and therefore misleading performance estimates. In addition, the differences in the models obtained in the double CV loop indicate that detailed chemical interpretation of a single proteochemometric model is uncertain when data sets are small.
Conclusion: The double CV loop employed offer unbiased performance estimates about a given proteochemometric modelling procedure, making it possible to identify cases where the proteochemometric design does not result in useful predictive models. Chemical interpretations of single proteochemometric models are uncertain and should instead be based on all the models selected in the double CV loop employed here.
Figures


Similar articles
-
Rough set-based proteochemometrics modeling of G-protein-coupled receptor-ligand interactions.Proteins. 2006 Apr 1;63(1):24-34. doi: 10.1002/prot.20777. Proteins. 2006. PMID: 16435365
-
Feature selection and nearest centroid classification for protein mass spectrometry.BMC Bioinformatics. 2005 Mar 23;6:68. doi: 10.1186/1471-2105-6-68. BMC Bioinformatics. 2005. PMID: 15788095 Free PMC article.
-
Bias in error estimation when using cross-validation for model selection.BMC Bioinformatics. 2006 Feb 23;7:91. doi: 10.1186/1471-2105-7-91. BMC Bioinformatics. 2006. PMID: 16504092 Free PMC article.
-
Comparing protein-ligand docking programs is difficult.Proteins. 2005 Aug 15;60(3):325-32. doi: 10.1002/prot.20497. Proteins. 2005. PMID: 15937897 Review.
-
Microarray data analysis: from disarray to consolidation and consensus.Nat Rev Genet. 2006 Jan;7(1):55-65. doi: 10.1038/nrg1749. Nat Rev Genet. 2006. PMID: 16369572 Review.
Cited by
-
Kinome-wide interaction modelling using alignment-based and alignment-independent approaches for kinase description and linear and non-linear data analysis techniques.BMC Bioinformatics. 2010 Jun 22;11:339. doi: 10.1186/1471-2105-11-339. BMC Bioinformatics. 2010. PMID: 20569422 Free PMC article.
-
Structural and conformational determinants of macrocycle cell permeability.Nat Chem Biol. 2016 Dec;12(12):1065-1074. doi: 10.1038/nchembio.2203. Epub 2016 Oct 17. Nat Chem Biol. 2016. PMID: 27748751
-
Chagas Disease: Perspectives on the Past and Present and Challenges in Drug Discovery.Molecules. 2020 Nov 23;25(22):5483. doi: 10.3390/molecules25225483. Molecules. 2020. PMID: 33238613 Free PMC article. Review.
-
The C1C2: a framework for simultaneous model selection and assessment.BMC Bioinformatics. 2008 Sep 2;9:360. doi: 10.1186/1471-2105-9-360. BMC Bioinformatics. 2008. PMID: 18761753 Free PMC article.
-
Reliable estimation of prediction errors for QSAR models under model uncertainty using double cross-validation.J Cheminform. 2014 Nov 26;6(1):47. doi: 10.1186/s13321-014-0047-1. eCollection 2014. J Cheminform. 2014. PMID: 25506400 Free PMC article.
References
-
- Wikberg JE, Mutulis F, Mutule I, Veiksina S, Lapinsh M, Petrovska R, Prusis P. Melanocortin receptors: ligands and proteochemometrics modeling. Ann N Y Acad Sci. 2003;994:21–26. - PubMed
-
- Wikberg J, Lapinsh M, Prusis P. Chemogenomics in drug discovery – a medicinal chemistry perspective. Weinheim: Wiley-VCH; 2004. Proteochemometrics: A tool for modelling the molecular interaction space; pp. 289–309. - PubMed
-
- Brereton RG. Chemometrics: Data Analysis for the Laboratory and Chemical Plan. John Wiley & Sons; 2003.
Publication types
MeSH terms
Substances
LinkOut - more resources
Full Text Sources

