

Searching QTL by gene expression: analysis of diabesity
- PMID: 15760467
- PMCID: PMC555939
- DOI: 10.1186/1471-2156-6-12
Searching QTL by gene expression: analysis of diabesity
Abstract
Background: Recent developments in sequence databases provide the opportunity to relate the expression pattern of genes to their genomic position, thus creating a transcriptome map. Quantitative trait loci (QTL) are phenotypically-defined chromosomal regions that contribute to allelically variant biological traits, and by overlaying QTL on the transcriptome, the search for candidate genes becomes extremely focused.
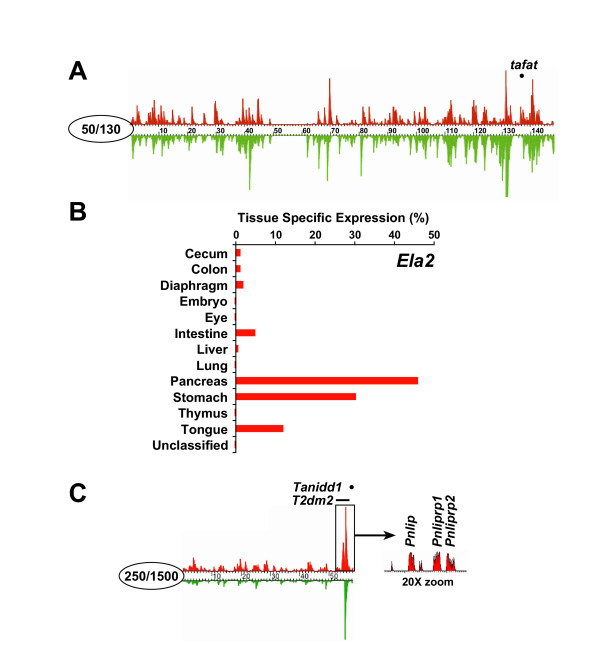
Results: We used our novel data mining tool, ExQuest, to select genes within known diabesity QTL showing enriched expression in primary diabesity affected tissues. We then quantified transcripts in adipose, pancreas, and liver tissue from Tally Ho mice, a multigenic model for Type II diabetes (T2D), and from diabesity-resistant C57BL/6J controls. Analysis of the resulting quantitative PCR data using the Global Pattern Recognition analytical algorithm identified a number of genes whose expression is altered, and thus are novel candidates for diabesity QTL and/or pathways associated with diabesity.
Conclusion: Transcription-based data mining of genes in QTL-limited intervals followed by efficient quantitative PCR methods is an effective strategy for identifying genes that may contribute to complex pathophysiological processes.
Figures
References
-
- http://www.jax.org/exquest ExQuest Browser
-
- Stoehr JP, Nadler ST, Schueler KL, Rabaglia ME, Yandell BS, Metz SA, Attie AD. Genetic obesity unmasks nonlinear interactions between murine type 2 diabetes susceptibility loci. Diabetes. 2000;49:1946–1954. - PubMed
Publication types
MeSH terms
Substances
LinkOut - more resources
Full Text Sources
Medical
Molecular Biology Databases
