Daily rhythm of cerebral blood flow velocity
- PMID: 15760472
- PMCID: PMC555580
- DOI: 10.1186/1740-3391-3-3
Daily rhythm of cerebral blood flow velocity
Abstract
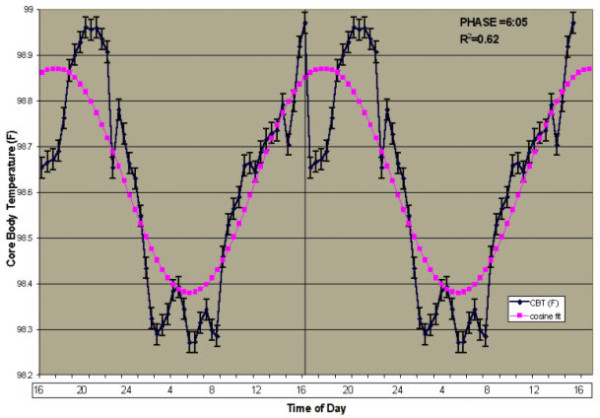
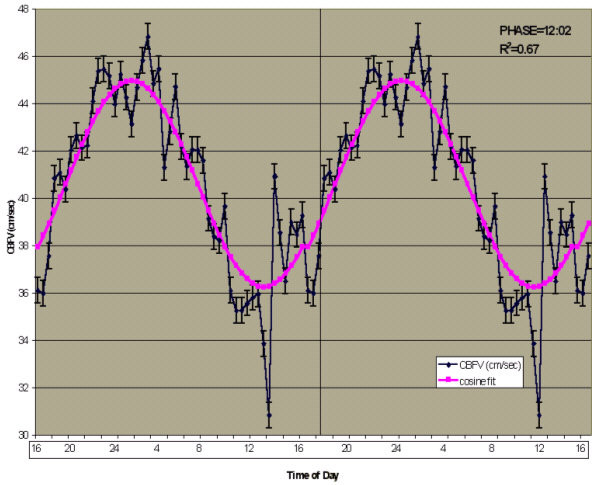
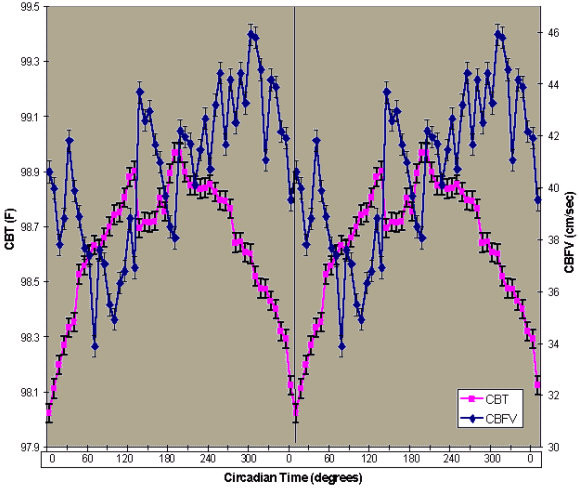
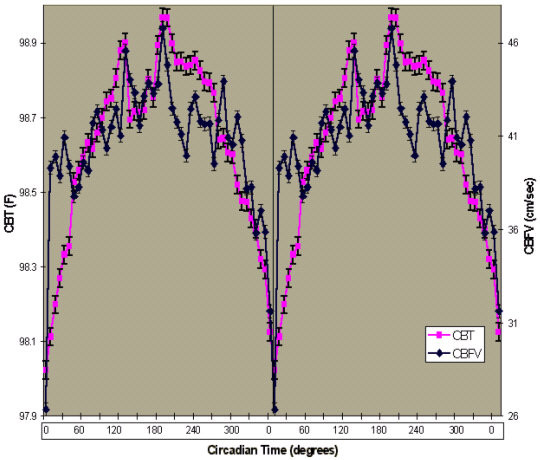
BACKGROUND: CBFV (cerebral blood flow velocity) is lower in the morning than in the afternoon and evening. Two hypotheses have been proposed to explain the time of day changes in CBFV: 1) CBFV changes are due to sleep-associated processes or 2) time of day changes in CBFV are due to an endogenous circadian rhythm independent of sleep. The aim of this study was to examine CBFV over 30 hours of sustained wakefulness to determine whether CBFV exhibits fluctuations associated with time of day. METHODS: Eleven subjects underwent a modified constant routine protocol. CBFV from the middle cerebral artery was monitored by chronic recording of Transcranial Doppler (TCD) ultrasonography. Other variables included core body temperature (CBT), end-tidal carbon dioxide (EtCO2), blood pressure, and heart rate. Salivary dim light melatonin onset (DLMO) served as a measure of endogenous circadian phase position. RESULTS: A non-linear multiple regression, cosine fit analysis revealed that both the CBT and CBFV rhythm fit a 24 hour rhythm (R2 = 0.62 and R2 = 0.68, respectively). Circadian phase position of CBT occurred at 6:05 am while CBFV occurred at 12:02 pm, revealing a six hour, or 90 degree difference between these two rhythms (t = 4.9, df = 10, p < 0.01). Once aligned, the rhythm of CBFV closely tracked the rhythm of CBT as demonstrated by the substantial correlation between these two measures (r = 0.77, p < 0.01). CONCLUSION: In conclusion, time of day variations in CBFV have an approximately 24 hour rhythm under constant conditions, suggesting regulation by a circadian oscillator. The 90 degree-phase angle difference between the CBT and CBFV rhythms may help explain previous findings of lower CBFV values in the morning. The phase difference occurs at a time period during which cognitive performance decrements have been observed and when both cardiovascular and cerebrovascular events occur more frequently. The mechanisms underlying this phase angle difference require further exploration.
Figures
References
-
- Droste DW, Berger W, Schuler E, Krauss K. Middle cerebral artery blood flow velocity in healthy persons during wakefulness and sleep: A Transcranial Doppler Study. Sleep. 1993;16:603–609. - PubMed
-
- Madsen PL, Holm S, Vorstrup S, Friberg L, Lassen NA, Wildschiodtz G. Human regional cerebral blood flow during rapid eye movement sleep. J Cereb Blood Flow Metab. 1991;11:502–507. - PubMed
-
- Risberg J, Ingvar DH. Increase of cerebral blood volume during REM-sleep in man. In: Koella WP, Levin P, editor. Sleep: Physiology, Biochemistry, Psychology, Pharmacology, Clinical Implications. Basel: Karger; 1972. pp. 384–388.
-
- Sakai F, Meyer JS, Karacan I, Yamaguchi F, Yamamoto M. Narcolepsy: regional cerebral blood flow during sleep and wakefulness. Neurology. 1979;29:61–67. - PubMed
LinkOut - more resources
Full Text Sources
Miscellaneous