. 2005 Apr 15;308(5720):385-9.
doi: 10.1126/science.1109557. Epub 2005 Mar 10.

Complement factor H polymorphism in age-related macular degeneration

Affiliations

Complement factor H polymorphism in age-related macular degeneration

Robert J Klein et al. Science. .

Abstract

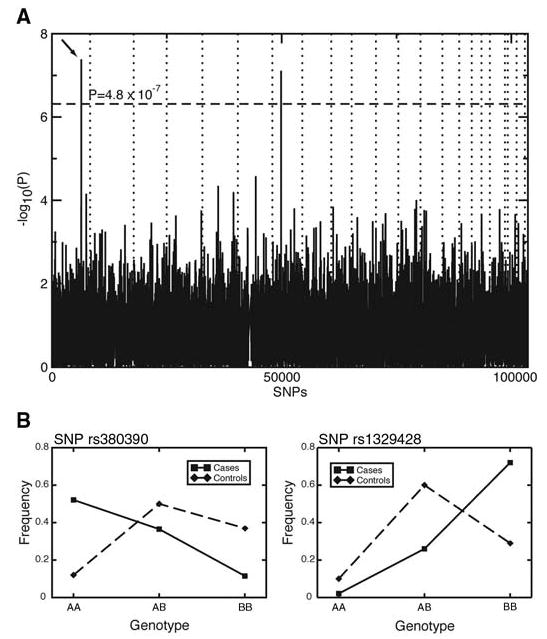
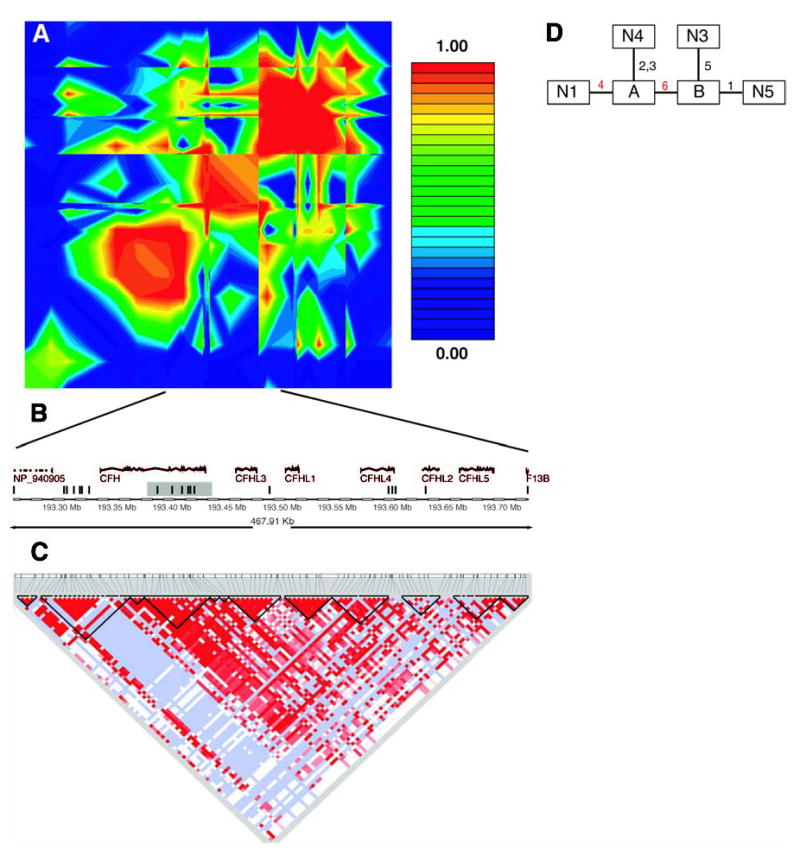
Age-related macular degeneration (AMD) is a major cause of blindness in the elderly. We report a genome-wide screen of 96 cases and 50 controls for polymorphisms associated with AMD. Among 116,204 single-nucleotide polymorphisms genotyped, an intronic and common variant in the complement factor H gene (CFH) is strongly associated with AMD (nominal P value <10(-7)). In individuals homozygous for the risk allele, the likelihood of AMD is increased by a factor of 7.4 (95% confidence interval 2.9 to 19). Resequencing revealed a polymorphism in linkage disequilibrium with the risk allele representing a tyrosine-histidine change at amino acid 402. This polymorphism is in a region of CFH that binds heparin and C-reactive protein. The CFH gene is located on chromosome 1 in a region repeatedly linked to AMD in family-based studies.


Figures

Fig. 1
Fig. 1
(A) P values of genome-wide association scan for genes that affect the risk of developing AMD. –log10(p) is plotted for each SNP in chromosomal order. The spacing between SNPs on the plot is uniform and does not reflect distances between SNPs on the chromosomes. The dotted horizontal line shows the cutoff for P = 0.05 after Bon-ferroni correction. The vertical dotted lines show chromosomal boundaries. The arrow indicates the peak for SNP rs380390, the most significant association, which was studied further. (B) Variation in genotype frequencies between cases and controls.
Fig. 2
Fig. 2
(A) Linkage disequilibrium across the CFH region, plotted as pairwise D′values. The red/orange box in the center of the plot is the region in strong linkage disequilibrium with the two associated SNPs in our data. (B) Schematic of the region in strong linkage disequilibrium with the two associated SNPs in our data. The vertical bars represent the approximate location of the SNPs available in our data set. The shaded region is the haplotype block found in the Hap-Map data. (C) Haplotype blocks in the HapMap CEU data cross the region. Darker shades of red indicate higher values of D′. Light blue indicates high D′with a low logarithm of the odds ratio for linkage (lod score). The dark lines show the boundaries of haplotype blocks. (D) Maximum-parsimony cladogram derived from haplotypes across the 6-SNP region. The number near each line indicates which of the six SNPs changes along that branch. The two red numbers are the two SNPs initially identified as being associated with AMD. SNP 4 is rs380390 and SNP 6 is rs1329428.
Fig. 3
Fig. 3
Immunofluorescence localization of CFH protein in human retina. Neighboring human retina sections are stained with (A) antibody to CFH or (B) antibody to CFH preabsorbed with CFH as negative control. (C) High-magnification view of the boxed area in (A). For (A), (B), and (C), left panels are the fluorescence images, with CFH labeling in green and DAPI (4′,6′-diamidino-2-phenylindole)–stained nuclei in blue; right panels are differential interference contrast (DIC) images showing the tissue morphology. In (C), the CFH signal is superimposed onto the DIC image. Labeling of CFH is intense in choroid, including blood vessels and areas bordering RPE [(A) and (C)]; this CFH signal is competed away by purified CFH protein (B), which demonstrates the labeling specificity. The fluorescence signal from RPE arises from lipofuscin autofluorescence, which cannot be competed away with CFH protein [(A) and (B)]. The black spots in DIC images correspond to melanin granules in RPE and choroids. The cell layers are indicated: GC, ganglion cells; INL, inner nuclear layer; ONL, outer nuclear layer; RPE, retinal pigment epithelium. Scale bars: 40 μm in (A) and (B), 20 μm in (C).

Comment in

References

    1. Friedman DS, et al. Arch Ophthalmol. 2004;122:564. - PubMed
    1. Tuo J, Bojanowski CM, Chan CC. Prog Retinal Eye Res. 2004;23:229. - PMC - PubMed
    1. AREDS Research Group. Ophthalmology. 2000;107:2224. - PubMed
    1. Majewski J, et al. Am J Hum Genet. 2003;73:540. - PMC - PubMed
    1. Seddon JM, Santangelo SL, Book K, Chong S, Cote J. Am J Hum Genet. 2003;73:780. - PMC - PubMed

Publication types

MeSH terms