. 2005 Apr;115(4):1060-7.
doi: 10.1172/JCI23273. Epub 2005 Mar 3.

Role of osteopontin in amplification and perpetuation of rheumatoid synovitis

Affiliations

Role of osteopontin in amplification and perpetuation of rheumatoid synovitis

Guangwu Xu et al. J Clin Invest. 2005 Apr.

Abstract

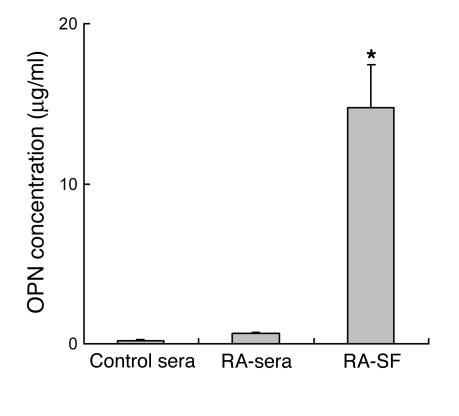
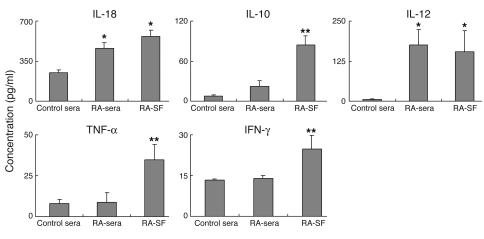
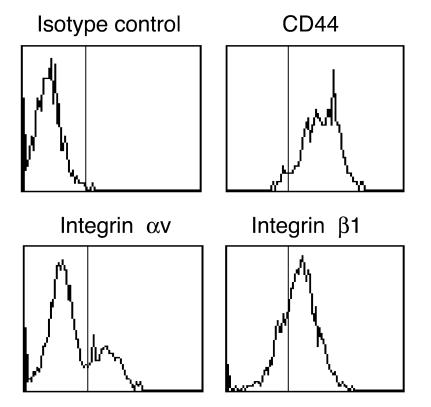
Osteopontin (OPN) is an extracellular matrix protein of pleiotropic properties and has been recently recognized as a potential inflammatory cytokine. In this study, we demonstrate, for the first time to our knowledge, that overexpression of OPN in synovial T cells is associated with local inflammatory milieu and that OPN acts as an important mediator in amplification and perpetuation of rheumatoid synovitis. The study revealed that mRNA expression of OPN was highly elevated in CD4(+) synovial T cells derived from patients with RA, which correlated with increased OPN concentrations in synovial fluid (SF). The pattern of OPN overexpression was confined to rheumatoid synovium and correlated with coexpression of selected OPN receptors in synovial T cells, including integrins alphav and beta1 and CD44. RA-derived SF stimulated the expression of OPN in T cells, which was attributable to IL-10 present in SF and abrogated by anti-IL-10 antibody. Among the more than 300 autoimmune and inflammatory response genes examined, OPN selectively induced the expression of proinflammatory cytokines and chemokines known to promote migration and recruitment of inflammatory cells. Furthermore, it was evident that OPN activated transcription factor NF-kappaB in mononuclear cells. The study has important implications for understanding the role of OPN in rheumatoid synovitis and other inflammatory conditions.


Figures

Figure 1
Figure 1
Expression of OPN mRNA in T cells derived from peripheral blood, SF, and ST. (A) RNA was extracted from T cells isolated from paired SF, ST, and peripheral blood of RA patients (n = 32) for real-time PCR analysis. A panel of control T cell preparations was obtained from 31 healthy individuals. OPN expression was normalized to endogenously expressed GAPDH in the same samples. Relative expression was calculated as the difference (ΔΔCT) between the ΔCT values of the test sample and of the endogenous control (GAPDH). Relative expression of OPN gene was calculated and expressed as 2–ΔΔCT (see Methods). (B) CD4+ T cells and CD8+ T cells were isolated from the same T cell preparations of SF specimens by magnetic bead separation and were analyzed for OPN expression by real-time PCR. The purity of the resulting T cell preparations was greater than 97%. The data represent the mean of 6 randomly selected individual T cell preparations. In all cases, asterisks indicate statistically significant differences between the groups (P < 0.05).
Figure 2
Figure 2
OPN protein concentrations in SF and serum specimens of RA patients. The OPN protein concentrations were measured by ELISA in 63 paired SF (RA-SF) and serum (RA-sera) samples of RA patients. A panel of 31 serum specimens from healthy individuals was included as a control. Asterisks indicate statistically significant differences between the groups (P < 0.05).
Figure 3
Figure 3
Cytokine concentrations in synovial and serum specimens of RA patients. Concentrations of 5 cytokines, including IL-18, IL-10, IL-12, TNF-α, and IFN-γ, were measured by ELISA in the same paired SF specimens and paired sera of RA patients as well as in control sera as described in the Figure 2 legend. Single asterisks indicate statistically significant differences between RA specimens (RA-SF or RA-sera) and control sera (P < 0.01) while double asterisks represent significant differences between RA-SF and RA-sera or control sera (P < 0.01).
Figure 4
Figure 4
Coexpression of OPN receptors in T cells isolated from peripheral blood, SF and ST of RA patients. RNA was extracted from isolated T cells of 32 paired ST, SF, and PBMC specimens of RA patients. A panel of 31 control T cell preparations was isolated from healthy individuals. mRNA expression of OPN receptors was normalized to endogenously expressed GAPDH in the same samples. The purity of T cells was greater than 97% for PBMC and SF specimens and 95% for ST specimens. Relative expression of OPN receptors was calculated as described in the Figure 1 legend. Asterisks indicate statistically significant differences between the groups (P < 0.01).
Figure 5
Figure 5
Surface expression of CD44, αv and β1 integrins on T cells derived from RA ST. Single-cell suspensions were prepared from RA-ST specimens. The surface expression of CD44 and αv and β1 integrins on gated T cells was analyzed by flow cytometry using specific monoclonal antibodies or an isotype-matched control antibody. The profiles shown were representative of 8 individual sample analyses.
Figure 6
Figure 6
Quantitative real-time PCR analysis of OPN mRNA expression in T cells in response to treatment with RA-SF. (A) Prefiltered SF of an RA patient was added, at a final dilution of 1:5, to cultures of PBMCs derived from 10 randomly selected RA patients and 10 healthy individuals matched for age and sex, respectively. After 48-hour incubation, cells were collected and CD2+ T cells were isolated for real-time PCR analysis of OPN expression. The purity of CD2+ T cells was greater than 97%. The data are representative of 4 separate experiments with SF specimens of different RA patients. (B) The dose-response pattern of OPN expression of the same PBMC specimens of RA patients (n = 10) in response to the indicated dilutions of RA SF and paired sera (n = 10) under the same experimental conditions as described in A. The results were reproduced with a panel of 10 purified CD4+ T cell preparations derived from RA patients and healthy individuals. Relative expression of OPN gene was calculated as described in the Figure 1 legend.
Figure 7
Figure 7
The induction of OPN expression by cytokines and the blocking effect of anti-IL-10 antibody. (A) PBMCs selected from RA patients (n = 10, as described in the Figure 6 legend) were cultured in the presence and absence of the indicated cytokines at a final concentration of 25 ng/ml for 48 hours. T cells were purified by magnetic bead separation and were subject to real-time PCR analysis of OPN expression. The purity of the isolated T cell preparations was greater than 97%. (B) The same PBMC preparations were cultured in the presence and absence (Medium [control]) of recombinant IL-10 used at the indicated concentrations to determine the dose-response pattern and kinetics of OPN expression in T cells. The resulting cells were harvested at the indicated time points and T cells were purified prior to real-time PCR analysis for OPN expression. (C) In parallel experiments, the same PBMCs (10 untreated samples) were cultured in the presence and absence (Medium [control]) of SF at a dilution of 1:5. A purified mouse anti-human IL-10 antibody or a mouse control antibody of matched isotype (anti-lysozyme antibody), respectively, was added at a final concentration of 5 μg/ml. T cells were subsequently isolated and analyzed for OPN expression by real-time PCR. The purity of T cells was greater than 97%. Dash indicates absence of antibody. (D) CD45RA+ and CD45RO+CD45RA T cell preparations were purified (n = 10; cell purity >97%) using magnetic beads coupled with specific antibodies and analyzed, together with PBMC preparations, for the expression of OPN by real-time PCR. Relative expression of OPN gene was calculated as described in the Figure 1 legend. In all cases, asterisks indicate statistically significant differences between the groups (P < 0.05).
Figure 8
Figure 8
Effect of OPN on the expression of genes corresponding to autoimmune and inflammatory responses. (A) The analyses were performed using an autoimmune and inflammatory response cDNA array system. A representative experiment is shown as dot blots representing the expression profile of selected genes of proinflammatory cytokines and chemokines as indicated at the supplier’s website (www.supperarray.com/gene_array_product/HTML/HS-602.3.html). PBMCs were treated with OPN at 1 μg/ml for 3 hours. The gene expression profile was compared with untreated PBMCs under the same experimental condition. After hybridization with sample cDNA, chemiluminescence was visualized by autoradiography, and digital data were analyzed using Bio-Rad Quantity One software. The results are given as ratio of gene expression of OPN treated to that of untreated controls (see Table 2). (B) PBMC preparations derived from separate RA patients were treated with OPN under the same experimental conditions as described above. The expression of the indicated chemokines and cytokines was analyzed by real-time PCR. Relative expression of the indicated genes was calculated as described in Methods. The differences between OPN treated and untreated control for all chemokines tested were statistically significant (P < 0.01).
Figure 9
Figure 9
Activation of transcription factor NF-κB by OPN. The effect of OPN on the activation of NF-κB in PBMC preparation derived from an RA patient was analyzed by EMSA. Cells were exposed to recombinant OPN at a concentration of 1 μg/ml for 30 minutes and were subjected to nuclear extraction and EMSA. Lanes 1 and 2, PBMCs treated with OPN; lanes 3 and 4, untreated controls; lane 5, PBMCs treated with TNF-α (40 ng/ml) for 40 minutes. In lanes 2 and 4, 100-fold unlabeled probe of NF-κB was used as a competing agent. The results are representative of 3 separate experiments with different PBMC preparations.

Similar articles

Cited by

References

    1. Londei M, et al. Persistence of collagen type II-specific T-cell clones in the synovial membrane of a patient with rheumatoid arthritis. Proc. Natl. Acad. Sci. U. S. A. 1989;86:636–640. - PMC - PubMed
    1. Pope RM, Pahlavani MA, Lacour E, Sambol S, Desai BV. Antigen specificity of rheumatoid synovial fluid lymphocytes. Arthritis Rheum. 1989;32:1371–1380. - PubMed
    1. Devereux D, O’Hehir RE, McGuire J, van Schooten WC, Lamb JR. HLA-DR4Dw4-restricted T cell recognition of self antigen(s) in the rheumatoid synovial compartment. Int. Immunol. 1991;3:635–640. - PubMed
    1. Res PC, et al. Inflamed joints of patients with rheumatoid arthritis contain T cells that display in vitro proliferation to antigens present in autologous synovial fluid. Function analysis on the basis of synovial-fluid-reactive T cell clones and lines. Hum. Immunol. 1994;40:291–298. - PubMed
    1. Choy EH, Panayi GS. Cytokine pathways and joint inflammation in rheumatoid arthritis. N. Engl. J. Med. 2001;344:907–916. - PubMed

Publication types

MeSH terms