. 2005 Mar 21;44(6):1826-36.
doi: 10.1021/ic0487068.

Spectroscopy of non-heme iron thiolate complexes: insight into the electronic structure of the low-spin active site of nitrile hydratase

Affiliations

Spectroscopy of non-heme iron thiolate complexes: insight into the electronic structure of the low-spin active site of nitrile hydratase

Pierre Kennepohl et al. Inorg Chem. .

Abstract

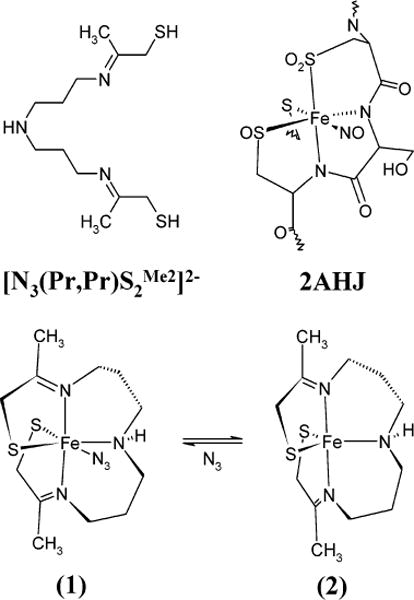
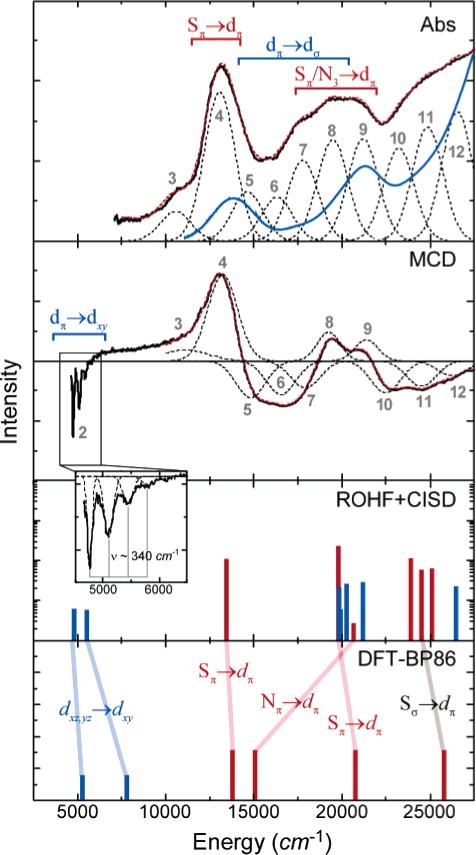
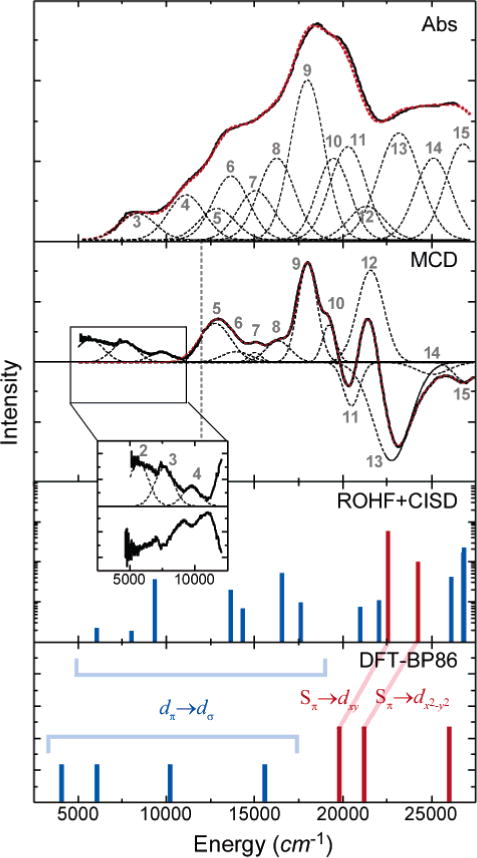
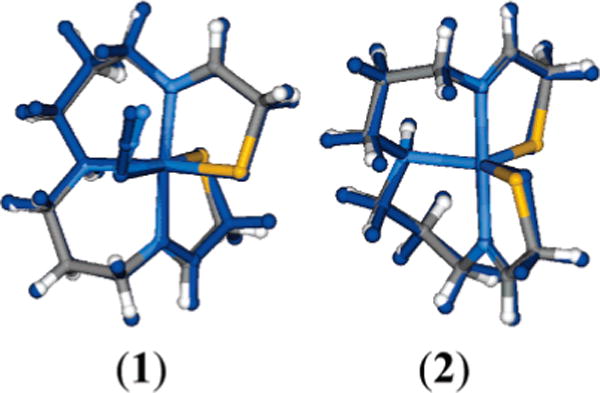
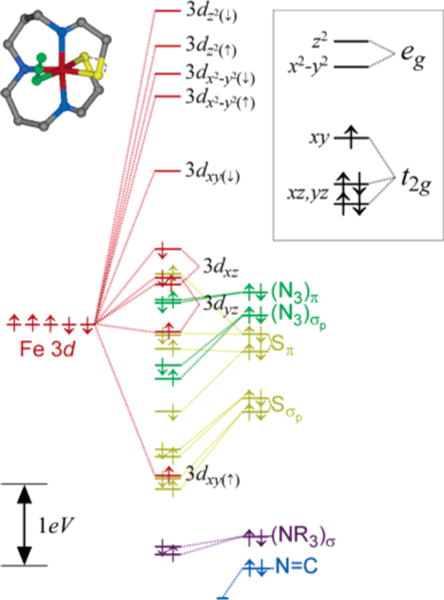
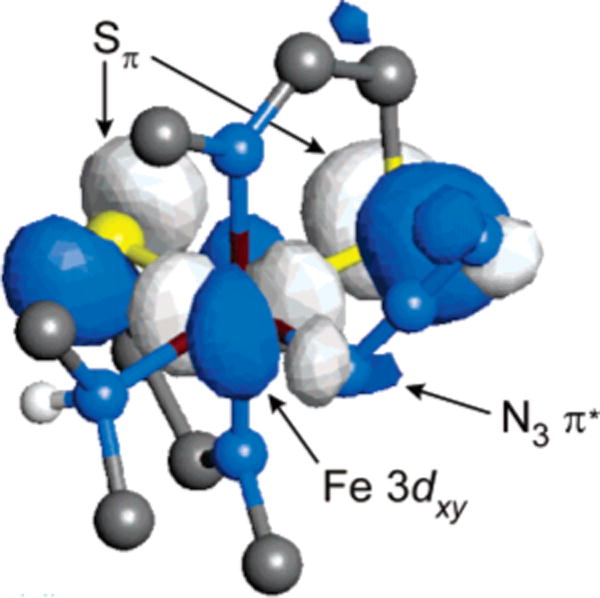
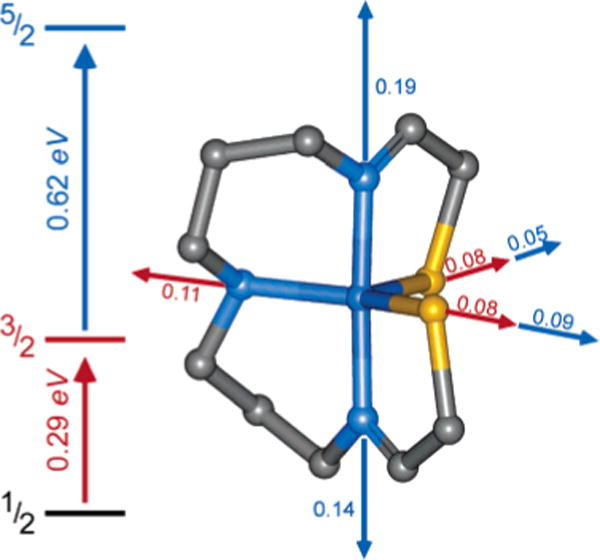
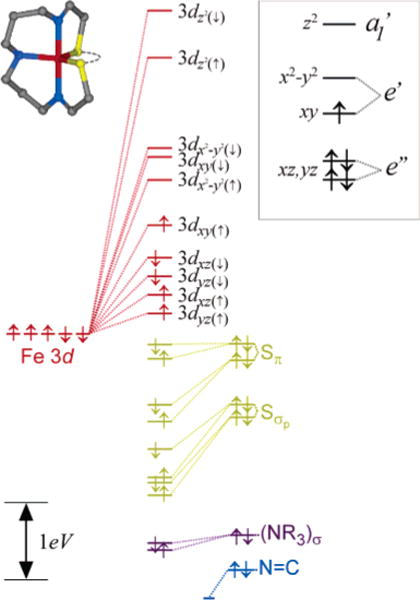
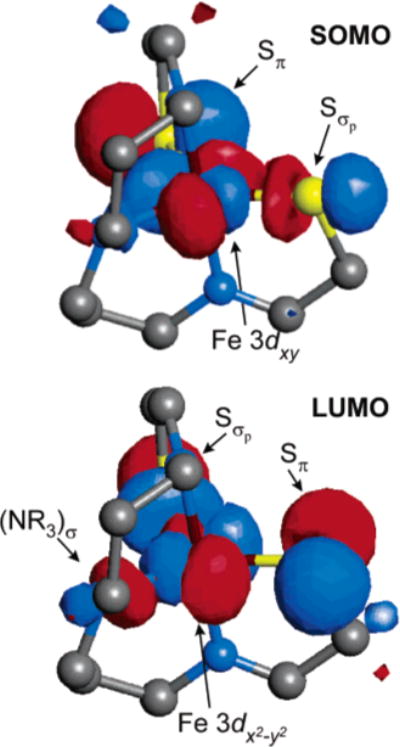
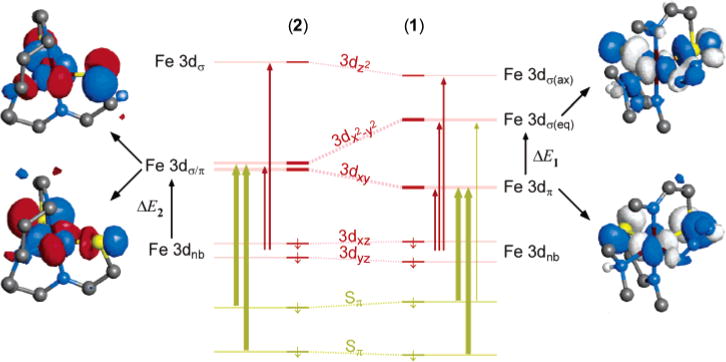
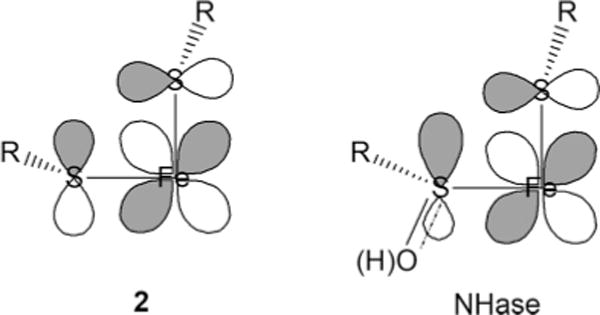
Detailed spectroscopic and computational studies of the low-spin iron complexes [Fe(III)(S2(Me2)N3 (Pr,Pr))(N3)] (1) and [Fe(III)(S2(Me2)N3 (Pr,Pr))]1+ (2) were performed to investigate the unique electronic features of these species and their relation to the low-spin ferric active sites of nitrile hydratases. Low-temperature UV/vis/NIR and MCD spectra of 1 and 2 reflect electronic structures that are dominated by antibonding interactions of the Fe 3d manifold and the equatorial thiolate S 3p orbitals. The six-coordinate complex 1 exhibits a low-energy S(pi) --> Fe 3d(xy) (approximately 13,000 cm(-1)) charge-transfer transition that results predominantly from the low energy of the singly occupied Fe 3d(xy) orbital, due to pure pi interactions between this acceptor orbital and both thiolate donor ligands in the equatorial plane. The 3d(pi) --> 3d(sigma) ligand-field transitions in this species occur at higher energies (>15,000 cm(-1)), reflecting its near-octahedral symmetry. The Fe 3d(xz,yz) --> Fe 3d(xy) (d(pi) --> d(pi)) transition occurs in the near-IR and probes the Fe(III)-S pi-donor bond; this transition reveals vibronic structure that reflects the strength of this bond (nu(e) approximately 340 cm(-1)). In contrast, the ligand-field transitions of the five-coordinate complex 2 are generally at low energy, and the S(pi) --> Fe charge-transfer transitions occur at much higher energies relative to those in 1. This reflects changes in thiolate bonding in the equatorial plane involving the Fe 3d(xy) and Fe 3d(x2-y2) orbitals. The spectroscopic data lead to a simple bonding model that focuses on the sigma and pi interactions between the ferric ion and the equatorial thiolate ligands, which depend on the S-Fe-S bond angle in each of the complexes. These electronic descriptions provide insight into the unusual S = 1/2 ground spin state of these complexes: the orientation of the thiolate ligands in these complexes restricts their pi-donor interactions to the equatorial plane and enforces a low-spin state. These anisotropic orbital considerations provide some intriguing insights into the possible electronic interactions at the active site of nitrile hydratases and form the foundation for further studies into these low-spin ferric enzymes.


Figures

Figure 1
Figure 1
Structural representation of the six-coordinate [FeIII(S2Me2N3(Pr,Pr))(N3)] (1) and five-coordinate [FeIII(S2Me2N3(Pr,Pr))]1+ (2) model complexes investigated in this study. In addition, the chelating ligand structure and that of the active site an NO-bound form of nitrile hydratase are also shown for comparison (obtained from the Protein Data Bank 2AHJ). Protons have been removed for clarity.
Figure 2
Figure 2
Low-temperature (5 K) spectroscopic data and computational results for six-coordinate model 1. Experimental Abs data are shown for the solid-state mull (black) and acetonitrile solution (blue). The LT-MCD data are shown only for the mull. Fits to the data (red dashed lines) were performed as described in the text; each of the Gaussian peaks in the fit is shown as black dashes. The experimental MCD data are combined data from independent near-IR and UV/vis experiments (grey dashed line indicates cutoff between the two spectra). For the ROHF–CISD and DFT calculations, ligand-field states are shown in black, and charge-transfer states are shown in red. Transition intensities have not been calculated from DFT calculations. Details of the computational methods are given in the Supporting Information (S2). The expanded-scale inset shows vibrational structure on the lowest-energy ligand-field excited state.
Figure 3
Figure 3
Low-temperature spectroscopic data and computational results for five-coordinate model 2. Experimental data are shown for the solid-state mull. The solution spectrum is not shown, as solvent binds at low temperatures (<150 K) to yield a six-coordinate species and high-temperature spectra are dominated by the high-spin form of 2. Fits to the data (red dashed lines) were performed as described in the text; each of the Gaussian fit peaks is shown (black dashes) and labeled to correspond with Table 2. The experimental MCD data are combined from independent near-IR and UV/vis experiments (grey dashed line indicates cutoff between the two spectra). For the ROHF–CISD and DFT calculations, ligand-field states are shown in black, and charge-transfer states are shown in red. Transition intensities have not been explicitly calculated from DFT calculations. Details of the computational methods are given in the Supporting Information (S3). Expanded-scale inset shows the lowest-energy ligand-field excited states in the 5000–10000 cm−1 region in MCD.
Figure 4
Figure 4
Comparison of the crystallographically defined and DFT-optimized (dark blue) geometries of complexes 1 and 2. See text for details.
Figure 5
Figure 5
Unrestricted DFT-BP86 ground-state orbital description of 1 using crystallographic coordinates. Results are extremely similar when using the DFT optimized coordinates (given in the Supporting Information). The complete orbital splitting diagram is color-coded according to the major atomic contributors for each of the molecular orbitals. The 3d orbital splitting pattern given in the inset identifies the restricted open-shell picture that best represents the calculated electronic structure (not to scale). See text for details.
Figure 6
Figure 6
Visual representation of the singly occupied Fe 3dxy orbital in complex 1. The ligands are truncated to facilitate viewing of the orbital surface. The major interactions with the central metal orbital occur with the two equatorial thiolate ligands with more minor interactions with the azide ligand.
Figure 7
Figure 7
DFT-calculated energetic and geometric changes in the S = ½, 3/2, and 5/2 spin states of complex 2. Bond distance changes are indicated in ångstroms.
Figure 8
Figure 8
Unrestricted DFT-BP86 ground-state orbital description of 2 using crystallographic coordinates. Results are extremely similar when using the DFT optimized coordinates. The complete orbital splitting diagram is color coded according to the major atomic contributors for each of the molecular orbitals. The 3d orbital splitting pattern given in the inset identifies the restricted open-shell picture that best represents the calculated electronic structure (not to scale). See text for details.
Figure 9
Figure 9
Visual representation of the singly occupied Fe 3dxy orbital (SOMO) and the lowest unoccupied Fe3dx2y2 orbital (LUMO) in complex 2. The major contributions to the SOMO and LUMO are indicated.
Figure 10
Figure 10
Summary of spectroscopic model used to interpret the observed Abs/MCD spectra and the overall electronic structures of complexes 1 and 2. The orbital splitting is that of the minority spin orbitals for each model complex; the most important spin-allowed transitions are indicated (<25000 cm−1). The orbital description of the 3dxy and 3dx2y2 orbitals in each complex is also given to emphasize the change in bonding between 2 and 1.
None
Chart 1

References

    1. Holm RH, Kennepohl P, Solomon EI. Chem Rev. 1996;96:2239–2314. - PubMed
    1. Stephens PJ, Jollie DR, Warshel A. Chem Rev. 1996;96:2491–2513. - PubMed
    1. Beinert H. J Biol Inorg Chem. 2000;5:2–15. - PubMed
    1. Costas M, Mehn MP, Jensen MP, Que L. Chem Rev. 2004;104:939–986. - PubMed
    1. Que L, Ho RYN. Chem Rev. 1996;96:2607–2624. - PubMed

Publication types