. 2005 Jun;88(6):3745-61.
doi: 10.1529/biophysj.104.058727. Epub 2005 Mar 11.

Imaging alpha-hemolysin with molecular dynamics: ionic conductance, osmotic permeability, and the electrostatic potential map

Affiliations

Imaging alpha-hemolysin with molecular dynamics: ionic conductance, osmotic permeability, and the electrostatic potential map

Aleksij Aksimentiev et al. Biophys J. 2005 Jun.

Abstract

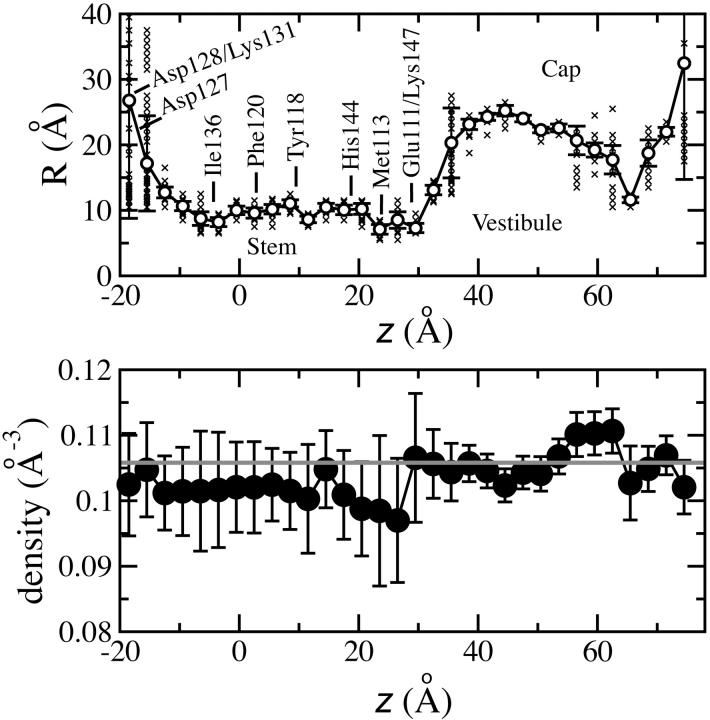
alpha-Hemolysin of Staphylococcus aureus is a self-assembling toxin that forms a water-filled transmembrane channel upon oligomerization in a lipid membrane. Apart from being one of the best-studied toxins of bacterial origin, alpha-hemolysin is the principal component in several biotechnological applications, including systems for controlled delivery of small solutes across lipid membranes, stochastic sensors for small solutes, and an alternative to conventional technology for DNA sequencing. Through large-scale molecular dynamics simulations, we studied the permeability of the alpha-hemolysin/lipid bilayer complex for water and ions. The studied system, composed of approximately 300,000 atoms, included one copy of the protein, a patch of a DPPC lipid bilayer, and a 1 M water solution of KCl. Monitoring the fluctuations of the pore structure revealed an asymmetric, on average, cross section of the alpha-hemolysin stem. Applying external electrostatic fields produced a transmembrane ionic current; repeating simulations at several voltage biases yielded a current/voltage curve of alpha-hemolysin and a set of electrostatic potential maps. The selectivity of alpha-hemolysin to Cl(-) was found to depend on the direction and the magnitude of the applied voltage bias. The results of our simulations are in excellent quantitative agreement with available experimental data. Analyzing trajectories of all water molecule, we computed the alpha-hemolysin's osmotic permeability for water as well as its electroosmotic effect, and characterized the permeability of its seven side channels. The side channels were found to connect seven His-144 residues surrounding the stem of the protein to the bulk solution; the protonation of these residues was observed to affect the ion conductance, suggesting the seven His-144 to comprise the pH sensor that gates conductance of the alpha-hemolysin channel.


Figures

FIGURE 1
FIGURE 1
Microscopic model of the α-hemolysin channel in its native environment, a lipid bilayer membrane. The channel is drawn as a molecular surface separating the protein from the membrane and water. The surface is colored according to the type of the exposed residues: red, blue, green, and white correspond to negatively charged, positively charged, polar, and nonpolar side chains, respectively. This surface is cut by the plane normal to the lipid bilayer, passing through the geometrical center of the protein. All but phosphorous atoms of the DPPC lipid bilayer are shown in green; the phosphorus atoms are shown as spheres. Water and ions are not shown. The model comprises 288,678 atoms.
FIGURE 2
FIGURE 2
Electrostatic potential maps of α-hemolysin. (a) A cut through the averaged (over an 11.2 ns simulation and the sevenfold symmetry of α-hemolysin) electrostatic potential along the z axis. A 0.6 V transmembrane bias was applied in this simulation. The average was taken over the instantaneous potentials computed by solving Poisson's equation; all point charges were approximated by Gaussians of inverse width β = 0.258 Å−1. (b) Same as in a, but β = 0.395 Å−1. (c) Profiles of the electrostatic potentials along the transmembrane pore of α-hemolysin. The red circles and the black squares correspond to β = 0.258 Å−1 and β = 0.395 Å−1, respectively. The black lines indicate fluctuations of the electrostatic profile in time (β = 0.395 Å−1). (d) The electrostatic radii of the channel (see text). The symbols have the same meaning as in c.
FIGURE 3
FIGURE 3
Bulk conductivity of KCl. (a) Ionic current I versus applied electrical field E. Each point derived from a 1 ns simulation. A linear regression fit, shown as a solid line, yielded a bulk conductivity of 12.3 S/m. (b) Conductivity κ of 1 M KCl (squares) and of 0.1 M KCl (diamonds) versus the size of the simulated system L = (LxLyLz)1/3. The dashed lines indicate the experimental value at 22.5°C, i.e., 11.0 and 1.2 S/m, respectively. The variation of the simulated conductivity with L is <10% at both concentrations. (c) Conductivity κ versus molar concentration c. Kohlrausch's law (Atkins, 1998) (formula image where Λ0 = 14.98 mS m2/mol is the limiting molar conductivity of KCl) is plotted as a dashed line; black diamonds show experimentally measured conductivities (Coury, 1999). (d) Molar conductivity Λm = κ/c versus molar concentration c. The dashed line and the solid diamonds have the same meaning as in panel c. The simulated molar conductivities deviate from theory and experiment at intermediate concentrations, but converge to experimental values at low and high salt conditions.
FIGURE 4
FIGURE 4
Structural fluctuations and occupancy of the transmembrane pore of α-hemolysin. (Top) The average radial profile of the transmembrane pore (circles). The average was taken over a 50 ns MD trajectory; the averaging method is described in the text. The error bars indicate the standard deviations of the average radii due to structural fluctuations of the pore. The lipid bilayer is centered at z = 0. The small symbols (x) display the distribution of the local radii during the 50 ns simulation. (Bottom) The average atomic density inside the transmembrane pore, defined by the radial profile shown at the top. The error bars indicate the standard deviations of the average. The shaded line shows the average number density of the entire system. The data suggest that water always fully occupies the internal volume of the transmembrane pore.
FIGURE 5
FIGURE 5
Asymmetry of the transmembrane pore. (Top) The ratio of the inertia moments of water inside the stem part of α-hemolysin, averaged over a 50 ns MD simulation. The inset shows a typical conformation of the transmembrane pore, viewed from the trans side (cf. Fig. 1). The cross section of the stem is an ellipse, on average. The longer axis of the elliptical cross section was observed to align with the boundary of two adjacent protomers. (Bottom) Normalized distribution of the angle that is formed by the major axis of the ellipse and the x axis. The distribution has two maxima, reflecting the two (out of seven) most frequent orientations of the ellipse. The reorientation of the cross section was observed to occur within several ns.
FIGURE 6
FIGURE 6
Computing the osmotic permeability of α-hemolysin for water. The collective coordinate of all water molecules inside the channel, n(t), (Eq. 4) is plotted versus time. n(t) quantifies the net amount of water permeation through the channel. (Inset) Mean-square displacement of n(t) versus time. The calculations were carried out with two sets of boundaries: −15.5 < z < 71.5 (squares) and −3.5 < z < 65.5 (circles) (cf. Fig. 4, top). A linear regression fit to the MSD curves yields the collective diffusion constant of water of 310 ± 10 molecules2/ns, which gives, after taking into account a correction for the low viscosity of TIP3P water, the osmotic permeability for water of 1.9 × 10⁻¹²cm3/s (see text).
FIGURE 7
FIGURE 7
Diffusion of water through side channels of α-hemolysin. Red, blue, orange, and yellow spheres illustrate positions of four water oxygens during a 3 ns simulation. At the beginning of the simulation, these water molecules located in the 20 Å < z < 30 Å portion of the transmembrane pore (cf. Fig. 4, top). For clarity, three protomers are shown in cartoon representation (white, pink, and cyan), whereas the other four are shown as a solvent-excluded surface (green). After entering the side channel from the vestibule, water was found to diffuse either directly to the bulk (red trace) or into the rim-stem crevice (blue, orange, and yellow traces). Water was also observed to diffuse around the stem through the rim-stem crevice, visiting several side channels (blue), and to diffuse directly into the crevice from the bulk (data not shown). See also Fig. 1.
FIGURE 8
FIGURE 8
Electrostatic potential maps of α-hemolysin at +120 mV (left) and at −120 mV (right) transmembrane bias. Each contour plot is a cut through the three-dimensional potential along the x, z plane. The maps were averaged over 9 (left) and 11 (right) ns trajectories. Color coding of the potential values is indicated on the right. All charged atoms contribute to the electrostatic maps shown (see Methods). The average profiles along the symmetry axis of the α-hemolysin pore are plotted in Fig. 9.
FIGURE 9
FIGURE 9
Average electrostatic potential along the symmetry axis of the α-hemolysin pore at +120 (circles) and −120 (squares) mV bias. The locations of the maxima in both profiles (indicated by vertical arrows) correlate with that of the average relative ion occupancy of the channel (cf. Fig. 10). Diamonds indicate the electrostatic profile at a zero external bias. Due to its low resolution, the zero bias potential has only a qualitative meaning. Lipids and protein are overlaid geometrically faithfully.
FIGURE 10
FIGURE 10
Distribution of ions inside the pore of α-hemolysin. (Top) Average normalized densities of K+ and Cl ions. (Inset) The total number of K+ and Cl ions increases during the equilibration. (Bottom) Relative occupancy of the α-hemolysin channel. This plot was obtained by dividing the density of Cl ions by that of K+, and averaging over different simulation conditions (all trajectories originated from the pH 8.0 structure). The error bars indicate the standard deviation of the average over different simulation conditions (see Table 2).
FIGURE 11
FIGURE 11
Cumulative currents through the transmembrane pore of α-hemolysin, resulting from the application of an external electric field. A linear increase of the cumulative currents with time indicates stationary currents; a linear regression fit to these curves gives the average current. The cumulative currents are shown in the units of the unitary charge (e = 1.6 × 10⁻¹⁹C). The open circles and the solid squares indicate the MD trajectories originating from the pH 8.0 and pH 4.5 structures, respectively.
FIGURE 12
FIGURE 12
Current/voltage characteristics of α-hemolysin computed with MD. The open circles and the solid squares indicate currents computed with the pH 8.0 and the pH 4.5 structures, respectively. The semisolid squares mark the simulations in which one of the loops at the trans end of the channel peeled off, transiently blocking the pore entrance. Each data point is derived from a 288,678-atom simulation of the system shown in Fig. 1. The dashed line indicates the linear fit through the data point at 120 mV and the origin. In accordance with experimental studies (Menestrina, 1986; Krasilnikov and Sabirov, 1989), the I/V curve is sublinear at V < 0 and a 1 M concentration of KCl. The absolute value of the ionic current at 120 mV, and the ratio of the currents at ± 120 mV, are also in good agreement with experiment (Meller and Branton, 2002; Krasilnikov and Sabirov, 1989). See also Fig. 11 and Table 2.
FIGURE 13
FIGURE 13
Equilibrium ionic permeability of α-hemolysin. The collective coordinate of all K+ and Cl ions, n, (Eq. 4) is plotted versus time. The inset shows the mean-square displacements of n. A linear regression fit to these data yields the collective diffusion coefficients of K+ and Cl of 0.32 and 0.38 ions2/ns, respectively.
FIGURE 14
FIGURE 14
Average profile of the electrostatic potential along the symmetry axis of the α-hemolysin channel. Circles and squares indicate +1.2 and −1.2 V biases, respectively; black and red symbols correspond to the simulations carried out with the pH 8.0 and the pH 4.5 structures, respectively. Lowering the pH was assumed to change the protonation states of seven His-144, altering the average potential in the upper half of the stem (0 < z < 30). These changes parallel the changes in the ionic conductance (Figs. 11 and 12) and ionic selectivity (Table 2).

Comment in

References

    1. Akenson, M., D. Branton, J. J. Kasianowicz, E. Brandin, and D. W. Deamer. 1999. Microsecond timescale discrimination among polycytidylic acid, polyadenylic acid, and polyuridylic acid as homopolymers or as segments within singe RNA molecules. Biophys. J. 77:3227–3233. - PMC - PubMed
    1. Aksimentiev, A., J. B. Heng, G. Timp, and K. Schulten. 2004. Microscopic kinetics of DNA translocation through synthetic nanopores. Biophys. J. 87:2086–2097. - PMC - PubMed
    1. Alcaraz, A., E. M. Nestrovich, M. Aguilella-Arzo, and V. M. Aquilella. 2004. Salting out the ionic selectivity of a wide channel: the asymmetry of OmpF. Biophys. J. 87:943–957. - PMC - PubMed
    1. Allen, M. P., and D. J. Tildesley. 1987. Computer Simulation of Liquids. Oxford University Press, New York.
    1. Anishkin, A., and S. Sukharev. 2004. Water dynamics and dewetting transitions in the small mechanosensitive channel MscS. Biophys. J. 86:2883–2895. - PMC - PubMed

Publication types

MeSH terms

LinkOut - more resources