

Detection and characterization of aggregates, prefibrillar amyloidogenic oligomers, and protofibrils using fluorescence spectroscopy
- PMID: 15764666
- PMCID: PMC1305650
- DOI: 10.1529/biophysj.104.049700
Detection and characterization of aggregates, prefibrillar amyloidogenic oligomers, and protofibrils using fluorescence spectroscopy
Abstract
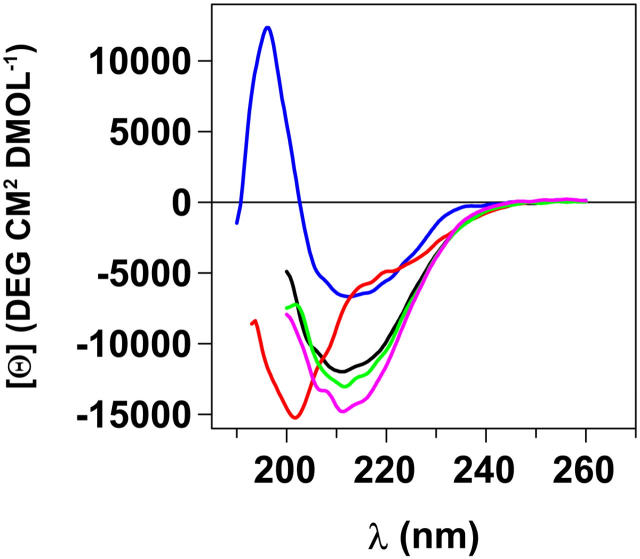
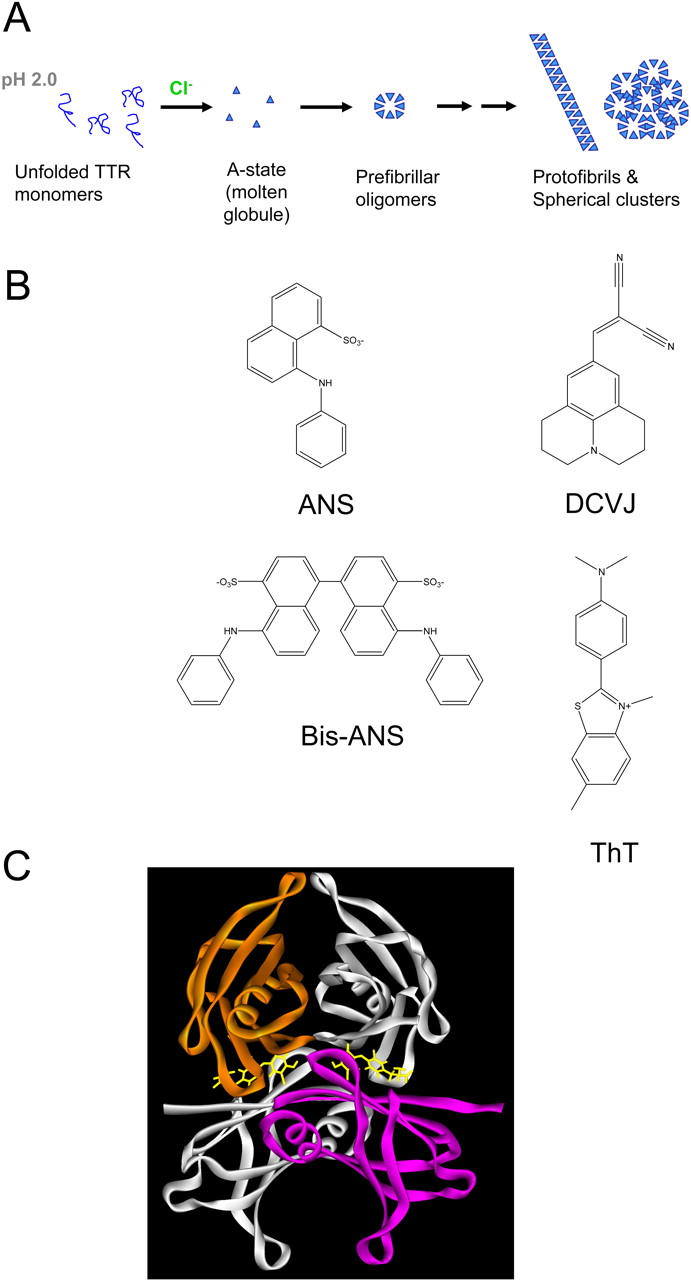
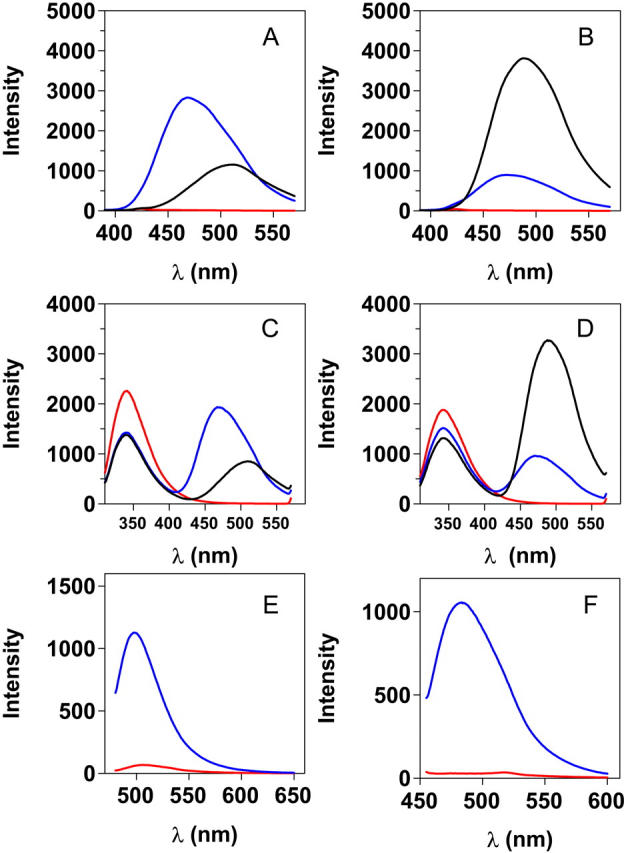
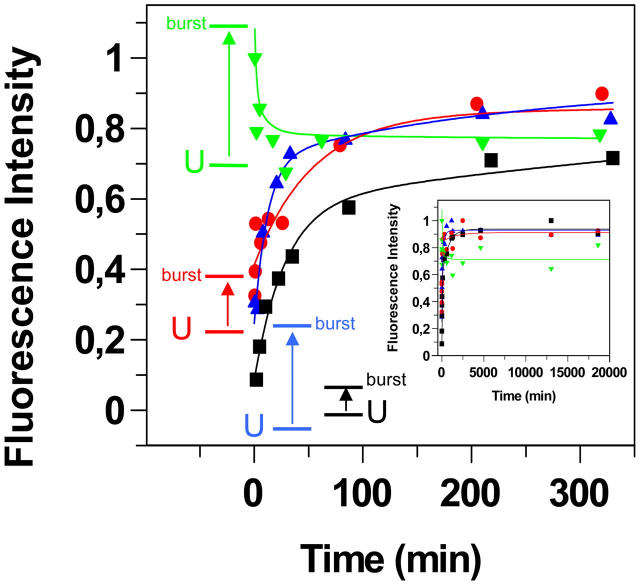
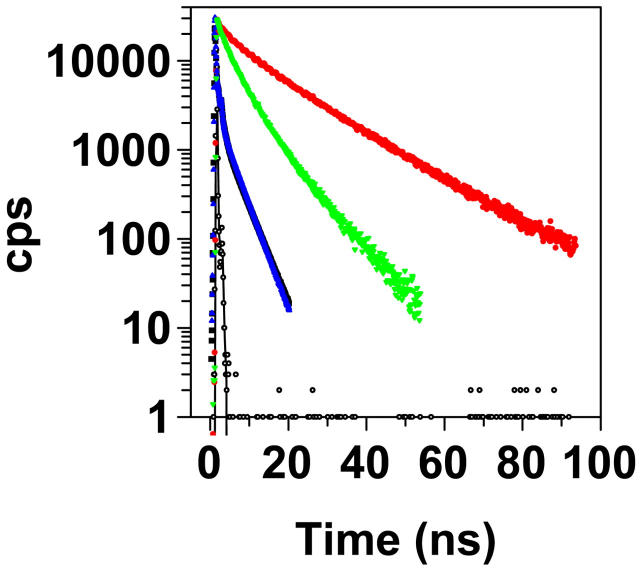
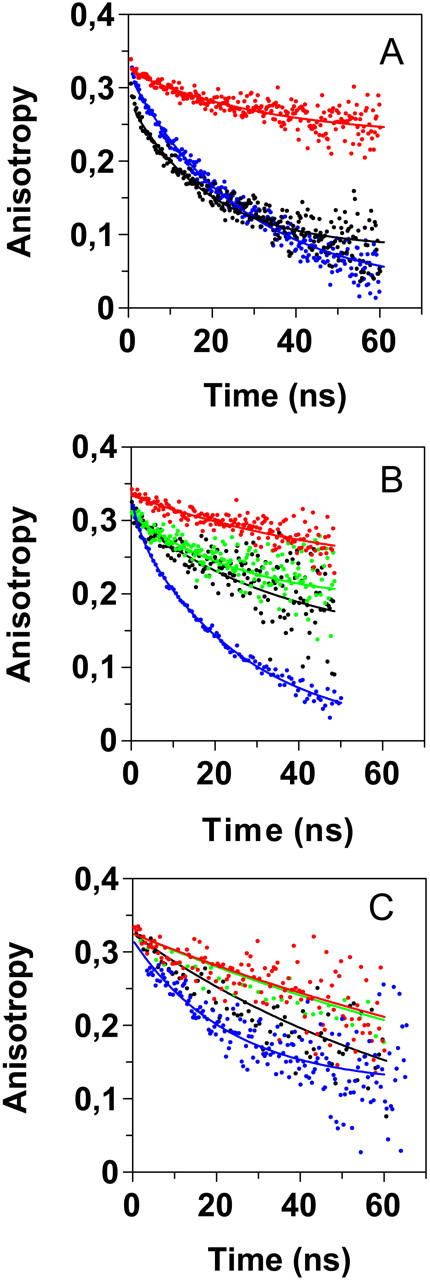
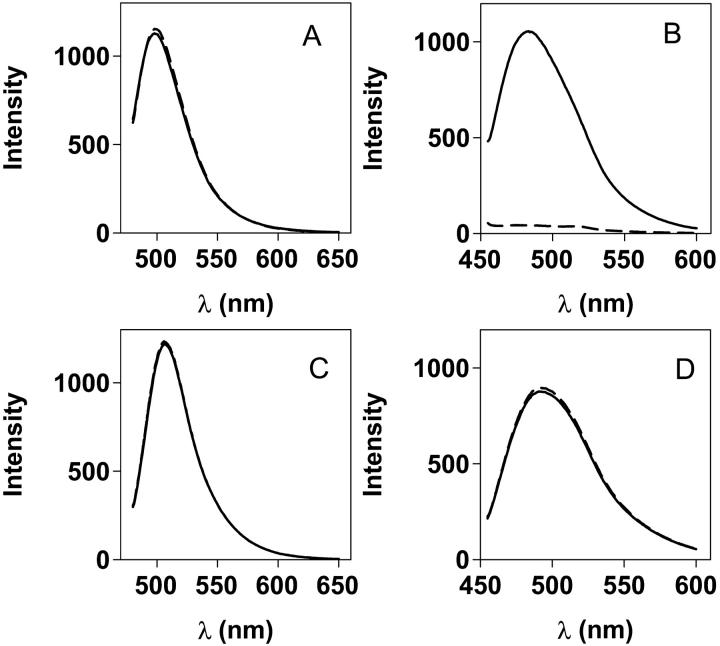
Transthyretin (TTR) is a protein linked to a number of different amyloid diseases including senile systemic amyloidosis and familial amyloidotic polyneuropathy. The transient nature of oligomeric intermediates of misfolded TTR that later mature into fibrillar aggregates makes them hard to study, and methods to study these species are sparse. In this work we explore a novel pathway for generation of prefibrillar aggregates of TTR, which provides important insight into TTR misfolding. Prefibrillar amyloidogenic oligomers and protofibrils of misfolded TTR were generated in vitro through induction of the molten globule type A-state from acid unfolded TTR through the addition of NaCl. The aggregation process produced fairly monodisperse oligomers (300-500 kD) within 2 h that matured after 20 h into larger spherical clusters (30-50 nm in diameter) and protofibrils as shown by transmission electron microscopy. Further maturation of the aggregates showed shrinkage of the spheres as the fibrils grew in length, suggesting a conformational change of the spheres into more rigid structures. The structural and physicochemical characteristics of the aggregates were investigated using fluorescence, circular dichroism, chemical cross-linking, and transmission electron microscopy. The fluorescent dyes 1-anilinonaphthalene-8-sulfonate (ANS), 4-4-bis-1-phenylamino-8-naphthalene sulfonate (Bis-ANS), 4-(dicyanovinyl)-julolidine (DCVJ), and thioflavin T (ThT) were employed in both static and kinetic assays to characterize these oligomeric and protofibrillar states using both steady-state and time-resolved fluorescence techniques. DCVJ, a molecular rotor, was employed for the first time for studies of an amyloidogenic process and is shown useful for detection of the early steps of the oligomerization process. DCVJ bound to the early prefibrillar oligomers (300-500 kD) with an apparent dissociation constant of 1.6 muM, which was slightly better than for ThT (6.8 muM). Time-resolved fluorescence anisotropy decay of ANS was shown to be a useful tool for giving further structural and kinetic information of the oligomeric aggregates. ThT dramatically increases its fluorescence quantum yield when bound to amyloid fibrils; however, the mechanism behind this property is unknown. Data from this work suggest that unbound ThT is also intrinsically quenched and functions similarly to a molecular rotor, which in combination with its environmental dependence provides a blue shift to the characteristic 482 nm wavelength when bound to amyloid fibrils.
Figures


Similar articles
-
Novel trans-Stilbene-based Fluorophores as Probes for Spectral Discrimination of Native and Protofibrillar Transthyretin.ACS Chem Neurosci. 2016 Jul 20;7(7):924-40. doi: 10.1021/acschemneuro.6b00062. Epub 2016 May 19. ACS Chem Neurosci. 2016. PMID: 27144293
-
Prefibrillar transthyretin oligomers and cold stored native tetrameric transthyretin are cytotoxic in cell culture.Biochem Biophys Res Commun. 2008 Dec 26;377(4):1072-8. doi: 10.1016/j.bbrc.2008.10.121. Epub 2008 Nov 5. Biochem Biophys Res Commun. 2008. PMID: 18983977
-
Retention of misfolded mutant transthyretin by the chaperone BiP/GRP78 mitigates amyloidogenesis.J Mol Biol. 2006 Feb 17;356(2):469-82. doi: 10.1016/j.jmb.2005.11.051. Epub 2005 Dec 5. J Mol Biol. 2006. PMID: 16376939
-
Amyloid oligomers: spectroscopic characterization of amyloidogenic protein states.FEBS J. 2010 Mar;277(6):1380-8. doi: 10.1111/j.1742-4658.2010.07571.x. Epub 2010 Feb 9. FEBS J. 2010. PMID: 20148961 Review.
-
Pressure-temperature folding landscape in proteins involved in neurodegenerative diseases and cancer.Biophys Chem. 2013 Dec 15;183:9-18. doi: 10.1016/j.bpc.2013.06.002. Epub 2013 Jun 14. Biophys Chem. 2013. PMID: 23849959 Review.
Cited by
-
Nicking and fragmentation are responsible for α-lactalbumin amyloid fibril formation at acidic pH and elevated temperature.Protein Sci. 2021 Sep;30(9):1919-1934. doi: 10.1002/pro.4144. Epub 2021 Jun 17. Protein Sci. 2021. PMID: 34107116 Free PMC article.
-
Unlocked concanavalin A forms amyloid-like fibrils from coagulation of long-lived "crinkled" intermediates.PLoS One. 2013 Jul 16;8(7):e68912. doi: 10.1371/journal.pone.0068912. Print 2013. PLoS One. 2013. PMID: 23874809 Free PMC article.
-
Evaluation of Peptide/Protein Self-Assembly and Aggregation by Spectroscopic Methods.Molecules. 2020 Oct 21;25(20):4854. doi: 10.3390/molecules25204854. Molecules. 2020. PMID: 33096797 Free PMC article. Review.
-
Effect of C-terminus amidation of Aβ39-42 fragment derived peptides as potential inhibitors of Aβ aggregation.RSC Adv. 2020 Jul 21;10(45):27137-27151. doi: 10.1039/d0ra04788k. eCollection 2020 Jul 15. RSC Adv. 2020. PMID: 35515767 Free PMC article.
-
Oxidation enhances human serum albumin thermal stability and changes the routes of amyloid fibril formation.PLoS One. 2014 Jan 8;9(1):e84552. doi: 10.1371/journal.pone.0084552. eCollection 2014. PLoS One. 2014. PMID: 24416244 Free PMC article.
References
-
- Buxbaum, J. N. 2003. Diseases of protein conformation: what do in vitro experiments tell us about in vivo diseases? Trends Biochem. Sci. 11:585–592. - PubMed
-
- Conrad, R. H., and L. Brand. 1968. Intramolecular transfer of excitation from tryptophan to 1-dimethylaminonaphthalene-5-sulfonamide in a series of model compounds. Biochemistry. 7:777–787. - PubMed
-
- Freskgård, P. O., L. G. Mårtensson, P. Jonasson, B.-H. Jonsson, and U. Carlsson. 1994. Assignment of the contribution of the tryptophan residues to the circular dichroism spectrum of human carbonic anhydrase II. Biochemistry. 33:14281–14288. - PubMed
-
- Haidekker, M. A., T. Brady, K. Wen, C. Okada, H. Y. Stevens, J. M. Snell, J. A. Frangos, and E. A. Theodorakis. 2000. Phospholipid-bound molecular rotors: synthesis and characterization. Bioorg. Med. Chem. 10:3627–3636. - PubMed
-
- Haidekker, M. A., T. Ling, M. Anglo, H. Y. Stevens, J. A. Frangos, and E. A. Theodorakis. 2001. New fluorescent probes for the measurement of cell membrane viscosity. Chem. Biol. 8:123–131. - PubMed
Publication types
MeSH terms
Substances
LinkOut - more resources
Full Text Sources
Other Literature Sources
Research Materials
Miscellaneous
