

Building up of the liquid-ordered phase formed by sphingomyelin and cholesterol
- PMID: 15764672
- PMCID: PMC1305634
- DOI: 10.1529/biophysj.104.054155
Building up of the liquid-ordered phase formed by sphingomyelin and cholesterol
Abstract
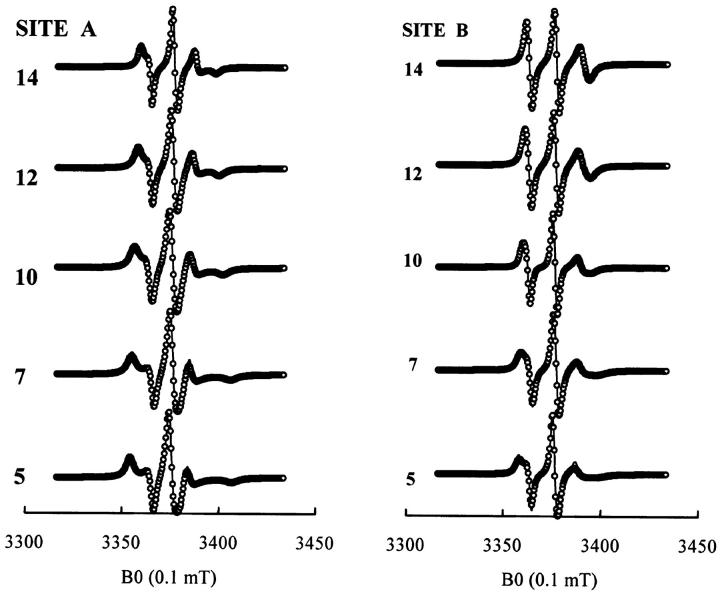
The long-range and molecular orders and dynamics in codispersions of egg sphingomyelin-cholesterol have been investigated by synchrotron x-ray diffraction and electron spin resonance using phosphatidylcholine spin-labeled at several positions on the sn-2 chain. Mixtures containing 0, 17, 33, 41, 50 mol% cholesterol exhibited a single phase by x-ray diffraction methods. The temperature dependence of the d-spacing between 20 and 50 degrees C is attenuated with increasing proportions of cholesterol, becoming invariant for cholesterol contents of 41 and 50 mol% on completion of the liquid-ordered phase. Electron spin resonance revealed two sites for 17 and 33 mol% cholesterol. One site is highly ordered and the other is less ordered than the fluid phase of pure sphingomyelin as shown by the molecular and the intramolecular order parameters reflecting the segmental motions of the probe. The two-sites exchange rate indicates a mean lifetime of the sites of approximately 0.1 micros during which the lipid displacement is approximately 1 nm. The short lifetime of the sites probed by ESR and the single phase detected by x-ray diffraction support in this binary mixture, the building up of the Lo phase by a progressive accumulation of randomly distributed sphingomyelin-cholesterol condensed complexes rather than by diffusional exchange between extended domains.
Figures


Similar articles
-
The role of sphingomyelin in regulating phase coexistence in complex lipid model membranes: competition between ceramide and cholesterol.Biochim Biophys Acta. 2008 Dec;1778(12):2727-39. doi: 10.1016/j.bbamem.2008.07.025. Epub 2008 Aug 5. Biochim Biophys Acta. 2008. PMID: 18722999
-
Thermotropic and structural evaluation of the interaction of natural sphingomyelins with cholesterol.Biochim Biophys Acta. 2009 Sep;1788(9):1877-89. doi: 10.1016/j.bbamem.2009.07.005. Epub 2009 Jul 17. Biochim Biophys Acta. 2009. PMID: 19616506
-
Egg-sphingomyelin and cholesterol form a stoichiometric molecular complex in bilayers of egg-phosphatidylcholine.J Phys Chem B. 2010 Dec 2;114(47):15536-45. doi: 10.1021/jp107490a. Epub 2010 Nov 4. J Phys Chem B. 2010. PMID: 21049976
-
Sphingomyelin: biophysical aspects.Chem Phys Lipids. 1999 Nov;102(1-2):29-34. doi: 10.1016/s0009-3084(99)00072-9. Chem Phys Lipids. 1999. PMID: 11001558 Review. No abstract available.
-
X-ray diffraction on biomembranes with emphasis on lipid moiety.Subcell Biochem. 1994;23:451-91. doi: 10.1007/978-1-4615-1863-1_11. Subcell Biochem. 1994. PMID: 7855880 Review. No abstract available.
Cited by
-
Cholesterol-pyrene as a probe for cholesterol distribution on ordered and disordered membranes: Determination of spectral wavelengths.PLoS One. 2018 Aug 10;13(8):e0201373. doi: 10.1371/journal.pone.0201373. eCollection 2018. PLoS One. 2018. PMID: 30096186 Free PMC article.
-
Phase equilibria in DOPC/DPPC-d62/cholesterol mixtures.Biophys J. 2009 Jan;96(2):521-39. doi: 10.1016/j.bpj.2008.09.042. Biophys J. 2009. PMID: 19167302 Free PMC article.
-
Molecular substructure of the liquid-ordered phase formed by sphingomyelin and cholesterol: sphingomyelin clusters forming nano-subdomains are a characteristic feature.Biophys Rev. 2022 Jun 11;14(3):655-678. doi: 10.1007/s12551-022-00967-1. eCollection 2022 Jun. Biophys Rev. 2022. PMID: 35791389 Free PMC article.
-
A raft-associated species of phosphatidylethanolamine interacts with cholesterol comparably to sphingomyelin. A Langmuir-Blodgett monolayer study.PLoS One. 2009;4(3):e5053. doi: 10.1371/journal.pone.0005053. Epub 2009 Mar 30. PLoS One. 2009. PMID: 19330037 Free PMC article.
-
Comparison of the liquid-ordered bilayer phases containing cholesterol or 7-dehydrocholesterol in modeling Smith-Lemli-Opitz syndrome.J Lipid Res. 2010 Jul;51(7):1810-22. doi: 10.1194/jlr.M003467. Epub 2010 Feb 10. J Lipid Res. 2010. PMID: 20147702 Free PMC article.
References
-
- Ahmed, S. N., D. A. Brown, and E. London. 1997. On the origin of sphingolipid/cholesterol-rich detergent-insoluble cell membranes: physiological concentrations of cholesterol and sphingolipid induce formation of a detergent-insoluble, liquid-ordered lipid phase in model membranes. Biochemistry. 36:10944–10953. - PubMed
-
- Almeida, P. F., W. L. Vaz, and T. E. Thompson. 1992. Lateral diffusion in the liquid phases of dimyristoylphosphatidylcholine/cholesterol lipid bilayers: a free volume analysis. Biochemistry. 31:6739–6747. - PubMed
-
- Aussenac, F., M. Tavares, and E. J. Dufourc. 2003. Cholesterol dynamics in membranes of raft composition: a molecular point of view from 2H and 31P solid-state NMR. Biochemistry. 42:1383–1390. - PubMed
-
- Boggs, J. M., and K. M. Koshy. 1994. Do the long fatty acid chains of sphingolipids interdigitate across the center of a bilayer of shorter chain symmetric phospholipids? Biochim. Biophys. Acta. 1189:233–241. - PubMed
-
- Boulin, C., R. Kempf, A. Gabriel, M. Koch, and S. McLaughlin. 1986. Data appraisal, evaluation and display for synchrotron radiation experiments: hardware and software. Nucl. Instrum. Methods. 249:399–409.
MeSH terms
Substances
LinkOut - more resources
Full Text Sources
Medical
Miscellaneous
