

Genotype-environment interactions in mouse behavior: a way out of the problem
- PMID: 15764701
- PMCID: PMC555503
- DOI: 10.1073/pnas.0409554102
Genotype-environment interactions in mouse behavior: a way out of the problem
Abstract
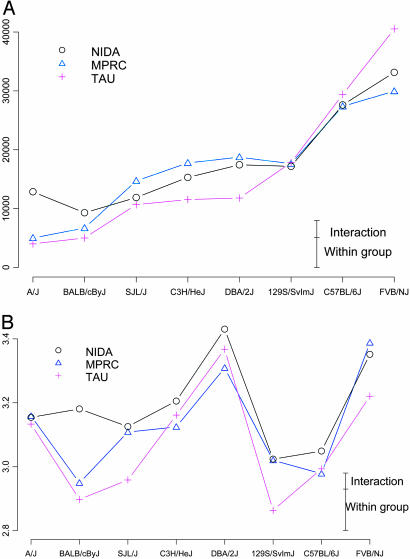
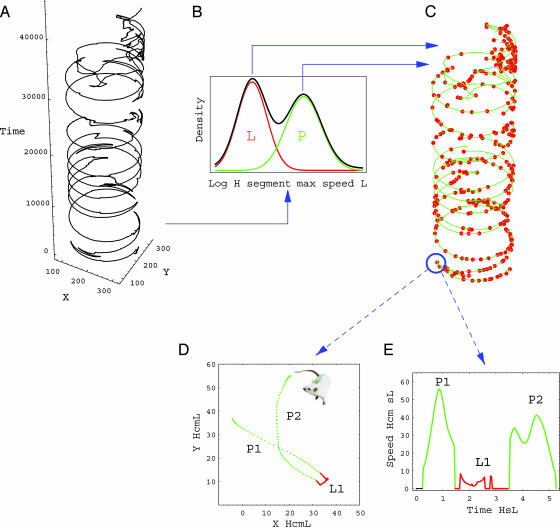
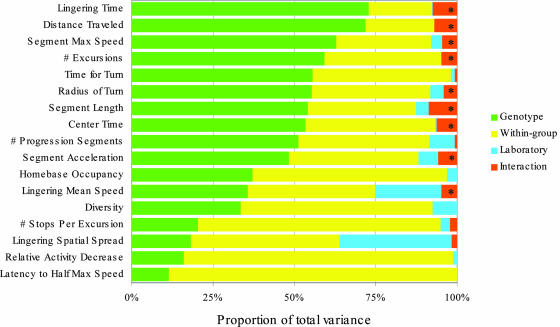
In behavior genetics, behavioral patterns of mouse genotypes, such as inbred strains, crosses, and knockouts, are characterized and compared to associate them with particular gene loci. Such genotype differences, however, are usually established in single-laboratory experiments, and questions have been raised regarding the replicability of the results in other laboratories. A recent multilaboratory experiment found significant laboratory effects and genotype x laboratory interactions even after rigorous standardization, raising the concern that results are idiosyncratic to a particular laboratory. This finding may be regarded by some critics as a serious shortcoming in behavior genetics. A different strategy is offered here: (i) recognize that even after investing much effort in identifying and eliminating causes for laboratory differences, genotype x laboratory interaction is an unavoidable fact of life. (ii) Incorporate this understanding into the statistical analysis of multilaboratory experiments using the mixed model. Such a statistical approach sets a higher benchmark for finding significant genotype differences. (iii) Develop behavioral assays and endpoints that are able to discriminate genetic differences even over the background of the interaction. (iv) Use the publicly available multilaboratory results in single-laboratory experiments. We use software-based strategy for exploring exploration (see) to analyze the open-field behavior in eight genotypes across three laboratories. Our results demonstrate that replicable behavioral measures can be practically established. Even though we address the replicability problem in behavioral genetics, our strategy is also applicable in other areas where concern about replicability has been raised.
Figures
References
-
- Crawley, J. N. & Paylor, R. (1997) Horm. Behav. 31, 197–211. - PubMed
-
- Rogers, D. C., Jones, D. N., Nelson, P. R., Jones, C. M., Quilter, C. A., Robinson, T. L. & Hagan, J. J. (1999) Behav. Brain Res. 105, 207–217. - PubMed
-
- Crabbe, J. C., Wahlsten, D. & Dudek, B. C. (1999) Science 284, 1670–1672. - PubMed
-
- Wahlsten, D., Metten, P., Phillips, T. J., Boehm, S. L., 2nd, Burkhart-Kasch, S., Dorow, J., Doerksen, S., Downing, C., Fogarty, J., Rodd-Henricks, K., et al. (2003) J. Neurobiol. 54, 283–311. - PubMed
-
- Anagnostopoulos, A. V., Sharp, J. J., Mobraaten, L. E., Eppig, J. T. & Davisson, M. T. (2001) Behav. Brain Res. 125, 33–37. - PubMed
Publication types
MeSH terms
Grants and funding
LinkOut - more resources
Full Text Sources
Other Literature Sources
