. 2005 Mar 14:6:55.
doi: 10.1186/1471-2105-6-55.

Speeding disease gene discovery by sequence based candidate prioritization

Affiliations

Speeding disease gene discovery by sequence based candidate prioritization

Euan A Adie et al. BMC Bioinformatics. .

Abstract

Background: Regions of interest identified through genetic linkage studies regularly exceed 30 centimorgans in size and can contain hundreds of genes. Traditionally this number is reduced by matching functional annotation to knowledge of the disease or phenotype in question. However, here we show that disease genes share patterns of sequence-based features that can provide a good basis for automatic prioritization of candidates by machine learning.

Results: We examined a variety of sequence-based features and found that for many of them there are significant differences between the sets of genes known to be involved in human hereditary disease and those not known to be involved in disease. We have created an automatic classifier called PROSPECTR based on those features using the alternating decision tree algorithm which ranks genes in the order of likelihood of involvement in disease. On average, PROSPECTR enriches lists for disease genes two-fold 77% of the time, five-fold 37% of the time and twenty-fold 11% of the time.

Conclusion: PROSPECTR is a simple and effective way to identify genes involved in Mendelian and oligogenic disorders. It performs markedly better than the single existing sequence-based classifier on novel data. PROSPECTR could save investigators looking at large regions of interest time and effort by prioritizing positional candidate genes for mutation detection and case-control association studies.


Figures
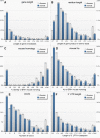
Figure 1
Figure 1
Histograms of selected features. Histograms showing distributions of selected features in both "disease genes" (those listed in OMIM) and control genes (those not). Data was binned for graphing purposes. Distributions are shown for (A) gene length in kilobases; (B) protein length in amino acids; (C) % identity of the best reciprocal hit (BRH) homolog in mouse; (D) Ka (a measure of non-synonymous change between species) of the BRH homolog in mouse; (E) number of exons and (F) 3' UTR length in basepairs.
Figure 2
Figure 2
The alternating decision tree. The alternating decision tree used to classify instances. A gene is classified with the tree by beginning at the node marked "Start" and then following each branch in turn. Upon reaching a node which contains an assumption the "yes" or "no" branch is followed as appropriate. If the relevant feature is "unknown", neither branch is followed. Adding up each of the numbers in rectangles that are encountered along the way results in a final score which reflects the relative confidence of the classification. The classification itself is based on the sign of the score.
Figure 3
Figure 3
Receiver Operating Characteristic (ROC) curves. Receiver Operating Characteristic (ROC) curves for the training set (A) and the two test sets (B and C). The true positive rate is measured along the y-axis and the false positive along the x-axis. The area under the resulting curve is a measure of classifier performance.
Figure 4
Figure 4
Performance over artificial loci. Relative performance on the sets of artificial loci created from the training set (yellow line), HGMD test set (the blue line) and oligogenic test set (the green line). The gray line represents the value expected if there had been no enrichment. The x axis represents the % of the ranked list in which the target gene was found; the y axis represents how frequent that occurrence was. For example, in the training set (the yellow line) the target gene was in the top 30% of the ranked list around 56% of the time.

References

    1. Glazier AM, Nadeau JH, Aitman TJ. Finding Genes That Underlie Complex Traits. Science. 2002;298:2345–2349. doi: 10.1126/science.1076641. - DOI - PubMed
    1. McCarthy M, Smedley D, Hide W. New methods for finding disease-susceptibility genes: impact and potential. Genome Biology. 2003;4:119. doi: 10.1186/gb-2003-4-10-119. - DOI - PMC - PubMed
    1. Devos D, Valencia A. Intrinsic errors in genome annotation. Trends in Genetics. 2001;17:429–431. doi: 10.1016/S0168-9525(01)02348-4. - DOI - PubMed
    1. Gilks WR, Audit B, De Angelis D, Tsoka S, Ouzounis CA. Modeling the percolation of annotation errors in a database of protein sequences. Bioinformatics. 2002;18:1641–1649. doi: 10.1093/bioinformatics/18.12.1641. - DOI - PubMed
    1. Pallen M, Wren B, Parkhill J. 'Going wrong with confidence': misleading sequence analyses of CiaB and ClpX. Molecular Microbiology. 1999;34:195. doi: 10.1046/j.1365-2958.1999.01561.x. - DOI - PubMed

MeSH terms