. 2005 Mar;7(3):239-49.
doi: 10.1016/j.ccr.2005.01.027.

Androgen ablation mitigates tolerance to a prostate/prostate cancer-restricted antigen

Affiliations

Androgen ablation mitigates tolerance to a prostate/prostate cancer-restricted antigen

Charles G Drake et al. Cancer Cell. 2005 Mar.

Abstract

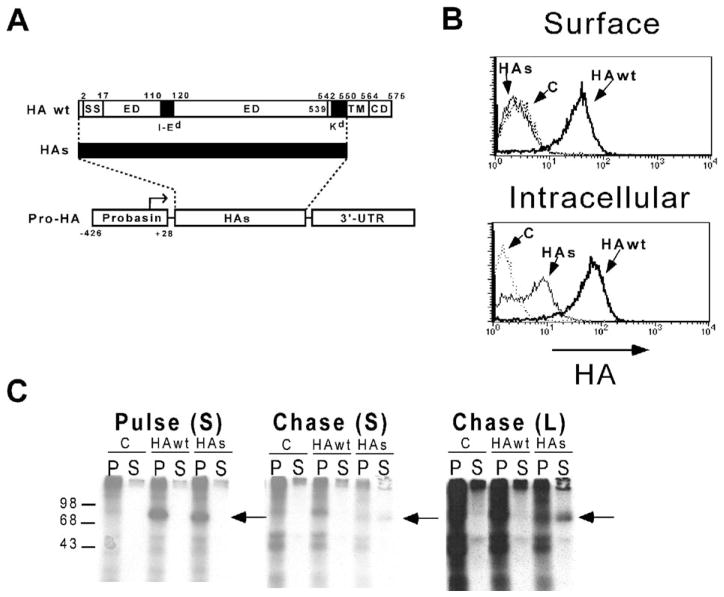
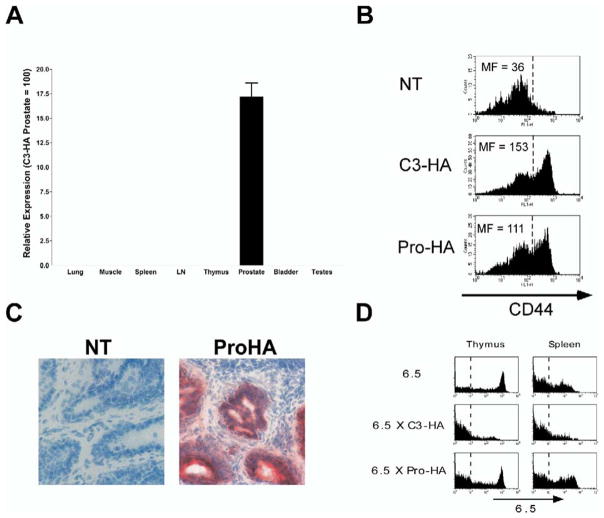
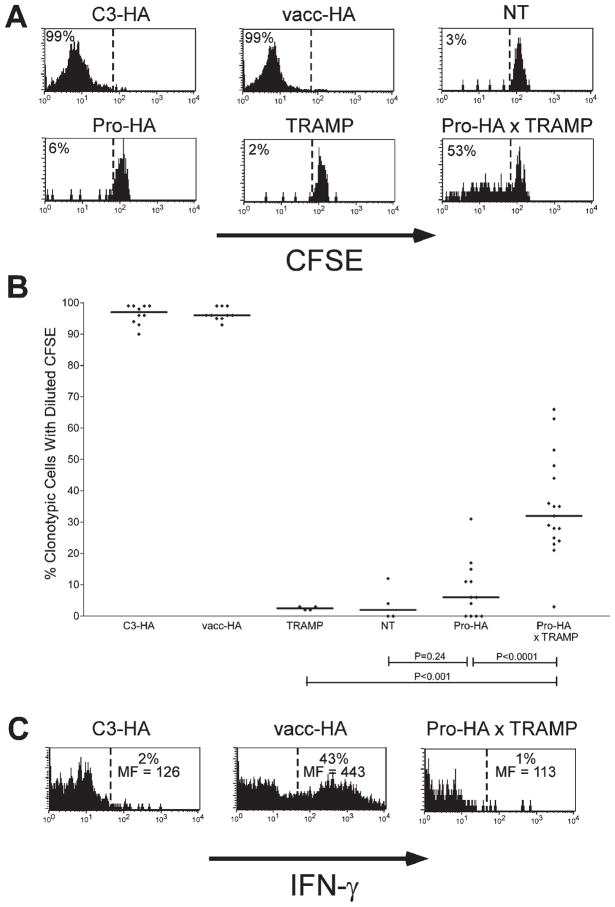
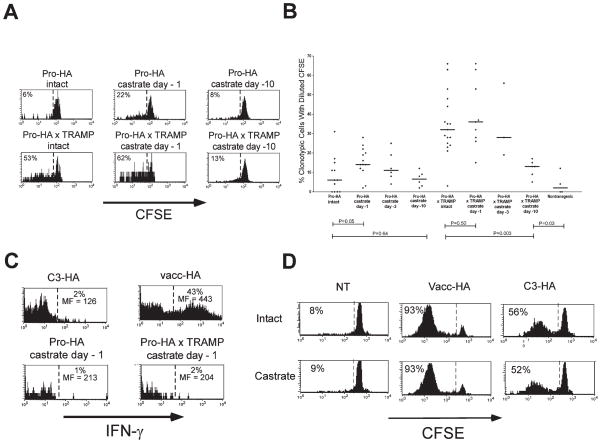
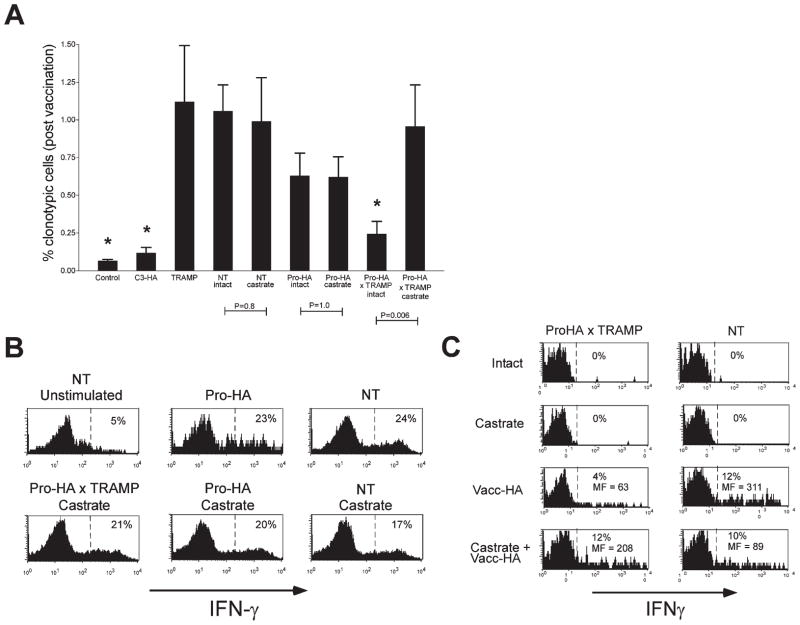
To understand the T cell response to prostate cancer, we created transgenic mice that express a model antigen in a prostate-restricted pattern and crossed these animals to TRAMP mice that develop spontaneous prostate cancer. Adoptive transfer of prostate-specific CD4 T cells shows that, in the absence of prostate cancer, the prostate gland is mostly ignored. Tumorigenesis allows T cell recognition of the prostate gland--but this recognition is tolerogenic, resulting in abortive proliferation and ultimately in hyporesponsiveness at the systemic level. Androgen ablation (the most common treatment for metastatic prostate cancer) was able to mitigate this tolerance--allowing prostate-specific T cells to expand and develop effector function after vaccination. These results suggest that immunotherapy for prostate cancer may be most efficacious when administered after androgen ablation.


Figures

Figure 1
Figure 1. The Pro-HA expression construct
A: The Pro-HA transgene, with the structure of the secreted HA (HAs) protein shown above. A map of the HA wt protein shows the locations of the ER signal sequence (SS, amino acids 2–17), the I-Ed epitope (amino acids 110–120, located within the extracellular domain [ED]), the Kd epitope (amino acids 542–550, located within the trans-membrane domain [TM, amino acids 539–564]), and the cytoplasmic domain (CD). The structure of the HAs protein is shown by a thick black line designating the portion of the wild-type protein that has been retained. B: Subcellular localization of HA wt and HAs proteins. FACS histogram plots of P815 cells infected with the indicated recombinant vaccinia (or not infected as a background staining control [C]) and stained for HA either directly (Surface) or after membrane fixation and permeabilization (Intracellular). C: Immunoprecipitation of HA wt and HAs proteins. COS-7 cells were transiently transfected with expression plasmids encoding the HA wt or HAs constructs, or the empty expression plasmid (C). Forty-eight hours later, they were labeled with [35S]methionine for 1 hr (pulse) and then cultured an additional 3 hr with an excess of cold methionine (chase). Following both the pulse and chase periods, cell pellets (P) as well as media supernatants (S) were harvested for immunoprecipitation using the anti-HA mAb H-18. Samples were analyzed by SDS-PAGE, with the location of molecular weight standards shown on the left, and the location of the HA proteins marked by an arrow to the right of each autoradiogram. Both short (S) as well as long (L) time exposures of the chase autoradiogram are shown.
Figure 2
Figure 2. Pro-HA transgenic mice express prostate-restricted hemagglutinin
A: Quantitative RT-PCR was performed on the indicated tissues of Pro-HA mice using HA-specific primers and probe. Relative expression is shown normalized to C3-HA prostate (100), which was used as a positive control for HA expression (Adler et al., 1998, 2000). Reactions were run in triplicate and repeated two times. B: Pro-HA mice express prostatic HA protein. Prostate homogenates from the indicated mice were injected into the footpads of NT recipients that had received adoptive transfers of naive 6.5 clonotypic CD4 cells the previous day. Five days later, single-cell suspensions prepared from the draining popliteal LNs were analyzed by FACS. Histogram plots of CD44 expression on gated clonotypic CD4 cells are presented with the mean fluorescence (MF) values shown to the left of the dashed reference line. The data shown is representative of several replicates. C: Infiltration of primed clonotypic CD8 cells into Pro-HA prostates. Pro-HA (right panel) and NT (control, left panel) mice expressing the Thy1.2 congenic marker received adoptive transfers of Thy1.1+ naive clone 4 clonotypic CD8 cells and were simultaneously inoculated with vacc-HA to prime the clonotypic CD8 cells. Two weeks later, frozen sections of dorsal prostate lobes were stained with an anti-Thy1.1 mAb (red stain) and counterstained with hematoxylin. The sections shown are representative of several mice. D: Thymic deletion of clonotypic CD4 cells does not occur in Pro-HA transgenic mice. 6.5 TCR single transgenic, 6.5 × C3-HA and 6.5 × Pro-HA double transgenic mice were analyzed for clonotypic TCR (i.e., 6.5) expression on CD4 single positive thymocytes and mature splenic CD4 cells. A dotted reference line indicates background 6.5 staining (determined from a NT control). Histogram plots are representative of multiple mice.
Figure 3
Figure 3. Prostate tumorigenesis alters presentation of prostate-epithelial antigen
Age-matched (6-month-old) Thy1.2+ NT, C3-HA, Pro-HA, TRAMP, Pro-HA x TRAMP, and vacc-HA-infected NT (vacc-HA) recipients received adoptive transfers of Thy1.1+ CFSE-labeled naive clonotypic CD4 cells, which were recovered from the prostate-draining periaortic LNs 6 days later. A: Representative proliferative responses (i.e., CFSE-dilutions) of clonotypic CD4 cells. The percentage of clonotypic CD4 cells (Thy1.1+ and 6.5+) exhibiting diluted CFSE fluorescence is shown to the left of the dashed reference line. B: Scatter plot showing the effect of tumorigenesis on clonotypic CD4 cell proliferation. The percentage of CFSE-diluted clonotypic CD4 cells are shown for individual mice, with horizontal lines designating the median values. p values were calculated using an unpaired two-tailed t test. C: Representative histogram plots of IFN-γ staining, with the percentage of cytokine-positive clonotypic CD4 cells, as well as the level of cytokine expression on these positive cells (expressed as mean fluorescence [MF]) shown above and below the reference bar, respectively.
Figure 4
Figure 4. Androgen ablation transiently increases presentation of prostate-epithelial antigen
Pro-HA and Pro-HA × TRAMP mice castrated at the indicated time points received adoptive transfers of Thy1.1+ CFSE-labeled naive clonotypic CD4 cells, which were recovered from the prostate-draining periaortic LNs 6 days later. A: Representative proliferative responses (i.e., CFSE dilutions) of clonotypic CD4 cells. B: Scatter plot showing the effect of androgen ablation on clonotypic CD4 cell proliferation is presented as in Figure 3B. C: Representative histogram plots of IFN-γ staining, with the percentage of cytokine-positive clonotypic CD4 cells, as well as the level of cytokine expression on these positive cells (expressed as mean fluorescence [MF]) shown above and below the reference bar, respectively. D: Comparison of CFSE dilution in clonotypic CD4 cells recovered from intact and castrated NT, vacc-HA-infected NT (vacc-HA), and C3-HA recipients.
Figure 5
Figure 5. Tumorigenesis induces systemic tolerization to prostate-epithelial antigens, while castration mitigates this effect
A: Age-matched (6-month-old) NT (n = 10), NT castrated at day −1 (n = 6), C3-HA (n = 10), Pro-HA (n = 10), Pro-HA castrated at day −1 (n = 10), TRAMP (n = 9), Pro-HA × TRAMP (n = 12), and Pro-HA × TRAMP castrated at day −1 (n = 6) Thy1.2+ recipients received adoptive transfers of 1 × 10⁵ unlabeled Thy1.1+ naive clonotypic CD4 cells, and 2 weeks later were challenged with 1 × 10⁶ pfu of vacc-HA. Control NT mice received T cells, but not vacc-HA (n = 7). Six days later, the frequency of clonotypic CD4 cells (identified as CD4+ and Thy1.1+) was measured in the prostate-non-draining axillary LNs. Asterisks indicate groups that are significantly different (p < 0.05, unpaired two-tailed t test) from the NT control group. B: Representative histogram plots of intracellular IFN-γ staining, with the percentage of cytokine-positive clonotypic CD4 cells shown. C: 12- to 14-week-old NT or ProHA × TRAMP mice were adoptively transferred with 1 × 10⁷ clonotypic CD4 cells 1 week prior to castration. After 1 additional week, animals were challenged with vacc-HA and harvested 5 days later. Representative histograms of clonotypic CD4 cell intracellular IFN-γ staining from irrelevant (systemic) LNs are shown.

References

    1. Adler AJ, Scheller A, Hoffman Y, Robins DM. Multiple components of a complex androgen-dependent enhancer. Mol Endocrinol. 1991;5:1587–1596. - PubMed
    1. Adler AJ, Scheller A, Robins DM. The stringency and magnitude of androgen-specific gene activation are combinatorial functions of receptor and nonreceptor binding site sequences. Mol Cell Biol. 1993;13:6326–6335. - PMC - PubMed
    1. Adler AJ, Marsh DW, Yochum GS, Guzzo JL, Nigam A, Nelson WG, Pardoll DM. CD4+ T cell tolerance to parenchymal self-antigens requires presentation by bone marrow-derived antigen-presenting cells. J Exp Med. 1998;187:1555–1564. - PMC - PubMed
    1. Adler AJ, Huang CT, Yochum GS, Marsh DW, Pardoll DM. In vivo CD4+ T cell tolerance induction versus priming is independent of the rate and number of cell divisions. J Immunol. 2000;164:649–655. - PubMed
    1. Anderson MS, Venanzi ES, Klein L, Chen Z, Berzins SP, Turley SJ, von Boehmer H, Bronson R, Dierich A, Benoist C, Mathis D. Projection of an immunological self shadow within the thymus by the aire protein. Science. 2002;298:1395–1401. - PubMed

Publication types