

Competitive enzymatic reaction to control allele-specific extensions
- PMID: 15767273
- PMCID: PMC1065263
- DOI: 10.1093/nar/gni048
Competitive enzymatic reaction to control allele-specific extensions
Abstract
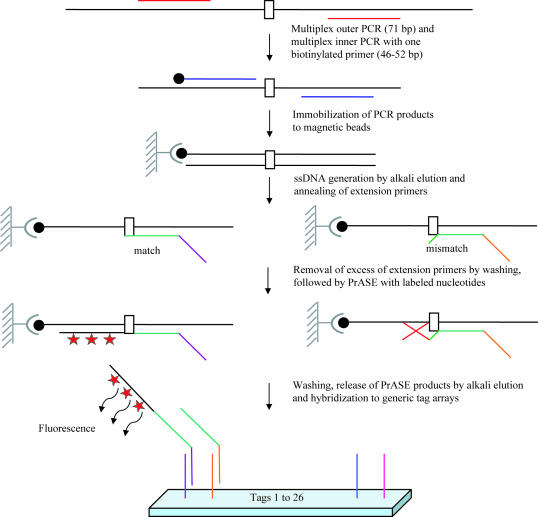
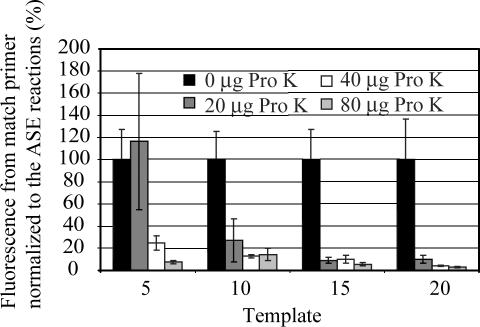
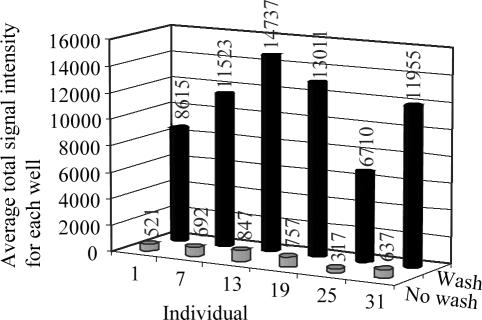
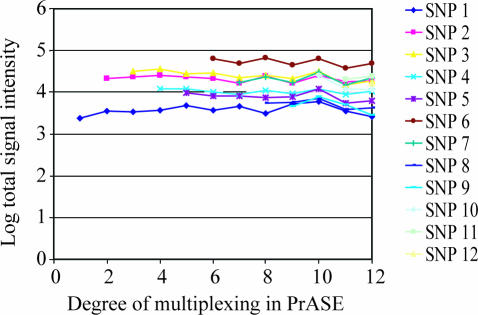
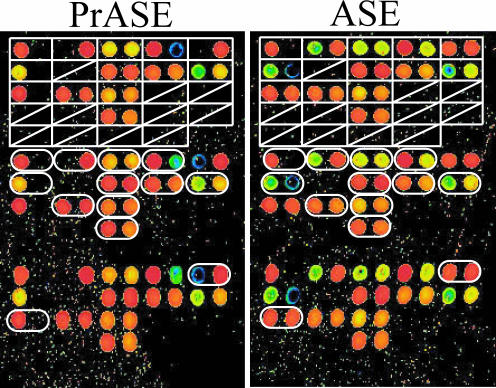
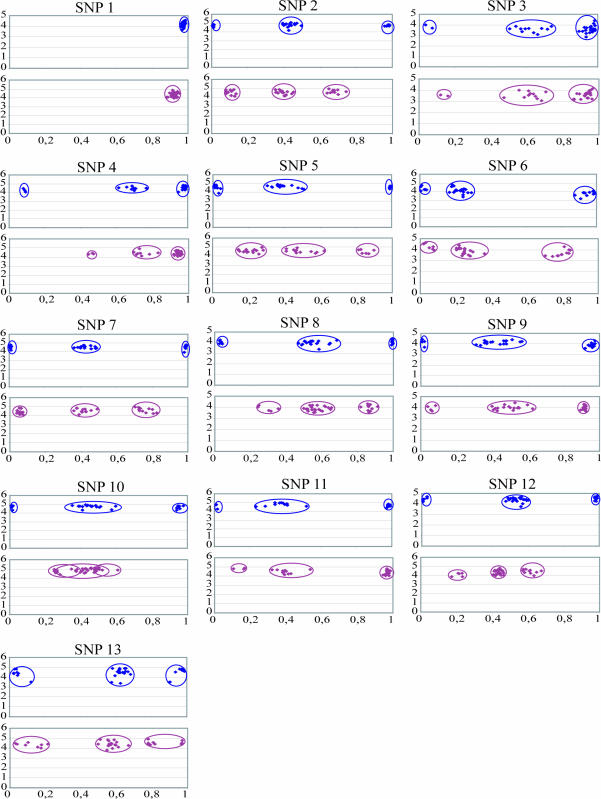
Here, we present a novel method for SNP genotyping based on protease-mediated allele-specific primer extension (PrASE), where the two allele-specific extension primers only differ in their 3'-positions. As reported previously [Ahmadian,A., Gharizadeh,B., O'Meara,D., Odeberg,J. and Lundeberg,J. (2001), Nucleic Acids Res., 29, e121], the kinetics of perfectly matched primer extension is faster than mismatched primer extension. In this study, we have utilized this difference in kinetics by adding protease, a protein-degrading enzyme, to discriminate between the extension reactions. The competition between the polymerase activity and the enzymatic degradation yields extension of the perfectly matched primer, while the slower extension of mismatched primer is eliminated. To allow multiplex and simultaneous detection of the investigated single nucleotide polymorphisms (SNPs), each extension primer was given a unique signature tag sequence on its 5' end, complementary to a tag on a generic array. A multiplex nested PCR with 13 SNPs was performed in a total of 36 individuals and their alleles were scored. To demonstrate the improvements in scoring SNPs by PrASE, we also genotyped the individuals without inclusion of protease in the extension. We conclude that the developed assay is highly allele-specific, with excellent multiplex SNP capabilities.
Figures
Similar articles
-
Comparison of PrASE and Pyrosequencing for SNP Genotyping.BMC Genomics. 2006 Nov 16;7:291. doi: 10.1186/1471-2164-7-291. BMC Genomics. 2006. PMID: 17107626 Free PMC article.
-
Genotyping of single-nucleotide polymorphisms by primer extension reaction in a dry-reagent dipstick format.Anal Chem. 2007 Jan 15;79(2):395-402. doi: 10.1021/ac061729e. Anal Chem. 2007. PMID: 17222001
-
Fluorescent microsphere-based readout technology for multiplexed human single nucleotide polymorphism analysis and bacterial identification.Hum Mutat. 2001 Apr;17(4):305-16. doi: 10.1002/humu.28. Hum Mutat. 2001. PMID: 11295829
-
Multiplex genotyping for thrombophilia-associated SNPs by universal bead arrays.Methods Mol Biol. 2009;496:59-72. doi: 10.1007/978-1-59745-553-4_6. Methods Mol Biol. 2009. PMID: 18839105 Review.
-
Primer design for multiplexed genotyping.Methods Mol Biol. 2007;402:269-86. doi: 10.1007/978-1-59745-528-2_13. Methods Mol Biol. 2007. PMID: 17951800 Review.
Cited by
-
Screening of common CYP1B1 mutations in Iranian POAG patients using a microarray-based PrASE protocol.Mol Vis. 2008;14:2349-56. Epub 2008 Dec 18. Mol Vis. 2008. PMID: 19096718 Free PMC article.
-
Narrow genetic basis for the Australian dingo confirmed through analysis of paternal ancestry.Genetica. 2012 Mar;140(1-3):65-73. doi: 10.1007/s10709-012-9658-5. Epub 2012 May 23. Genetica. 2012. PMID: 22618967 Free PMC article.
-
Recombinant expression library of Pyrococcus furiosus constructed by high-throughput cloning: a useful tool for functional and structural genomics.Front Microbiol. 2015 Sep 11;6:943. doi: 10.3389/fmicb.2015.00943. eCollection 2015. Front Microbiol. 2015. PMID: 26441878 Free PMC article.
-
Comparison of PrASE and Pyrosequencing for SNP Genotyping.BMC Genomics. 2006 Nov 16;7:291. doi: 10.1186/1471-2164-7-291. BMC Genomics. 2006. PMID: 17107626 Free PMC article.
-
Algorithm for automatic genotype calling of single nucleotide polymorphisms using the full course of TaqMan real-time data.Nucleic Acids Res. 2006 Apr 14;34(7):e56. doi: 10.1093/nar/gkl185. Nucleic Acids Res. 2006. PMID: 16617143 Free PMC article.
References
-
- Ahmadian A., Lundeberg J. A brief history of genetic variation analysis. BioTechniques. 2002;32:1122–1124. 1126, 1128 passim. - PubMed
-
- Syvänen A.C. Accessing genetic variation: genotyping single nucleotide polymorphisms. Nature Rev. Genet. 2001;2:930–942. - PubMed
-
- Wang D.G., Fan J.B., Siao C.J., Berno A., Young P., Sapolsky R., Ghandour G., Perkins N., Winchester E., Spencer J., et al. Large-scale identification, mapping, and genotyping of single- nucleotide polymorphisms in the human genome. Science. 1998;280:1077–1082. - PubMed
-
- Howell W.M., Jobs M., Gyllensten U., Brookes A.J. Dynamic allele-specific hybridization. A new method for scoring single nucleotide polymorphisms. Nat. Biotechnol. 1999;17:87–88. - PubMed
Publication types
MeSH terms
Substances
LinkOut - more resources
Full Text Sources
Other Literature Sources
Research Materials
