. 2005 Apr;79(7):3903-19.
doi: 10.1128/JVI.79.7.3903-3919.2005.

Heterogeneity of a fluorescent tegument component in single pseudorabies virus virions and enveloped axonal assemblies

Affiliations

Heterogeneity of a fluorescent tegument component in single pseudorabies virus virions and enveloped axonal assemblies

T del Rio et al. J Virol. 2005 Apr.

Abstract

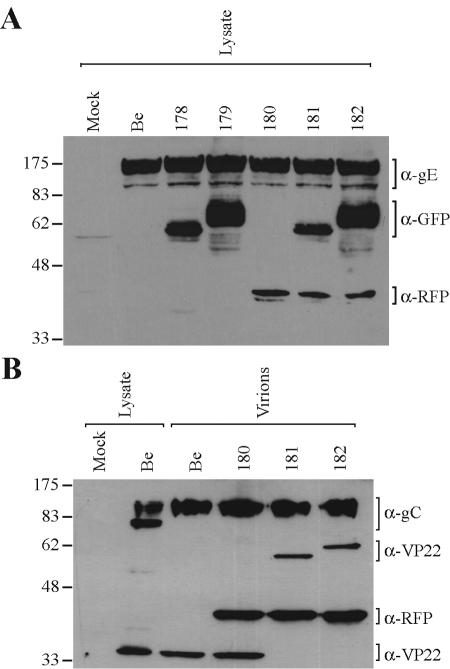
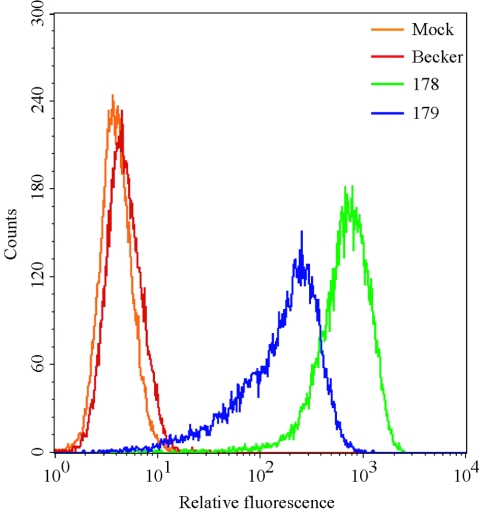
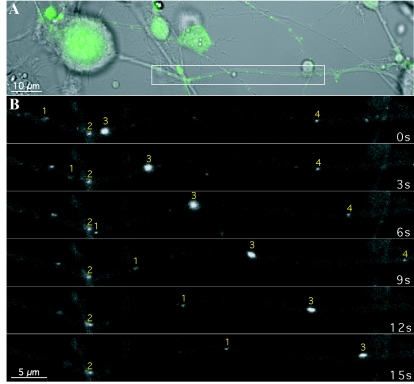
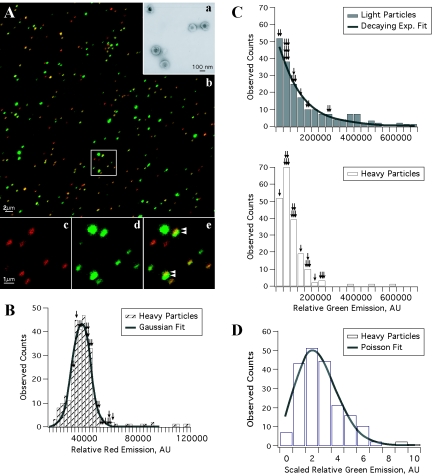
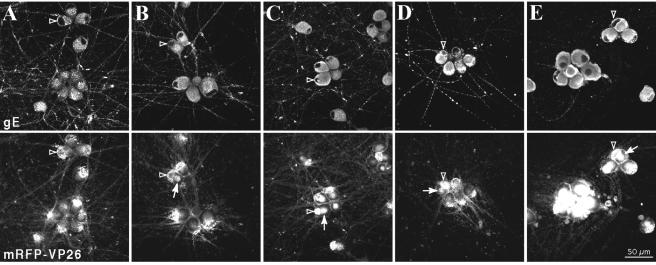
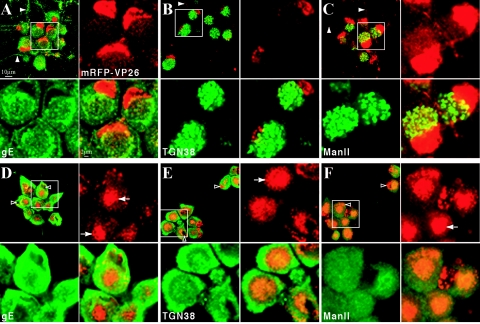
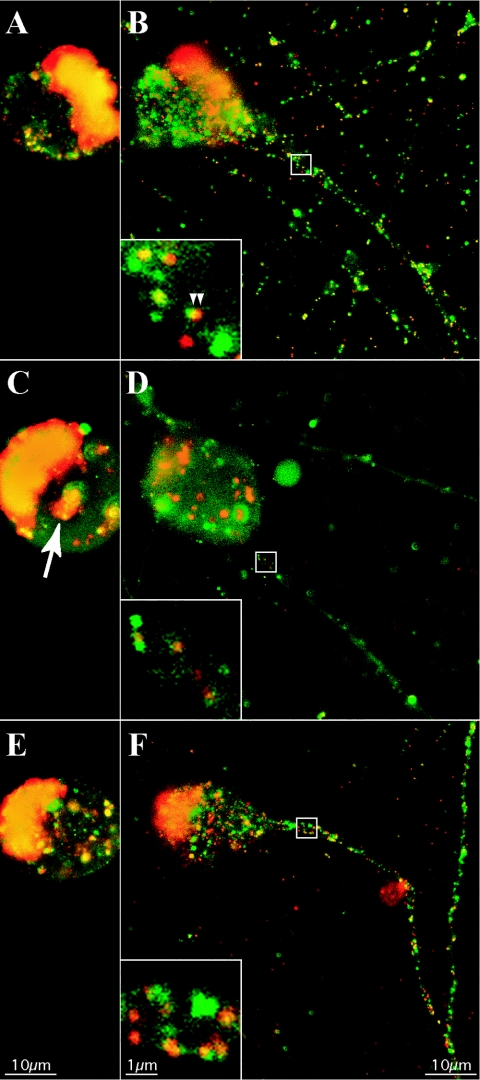
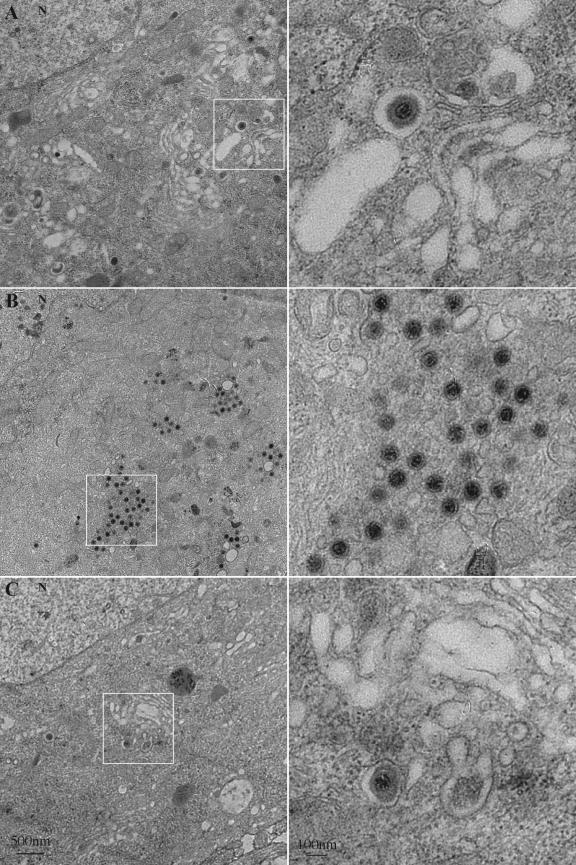
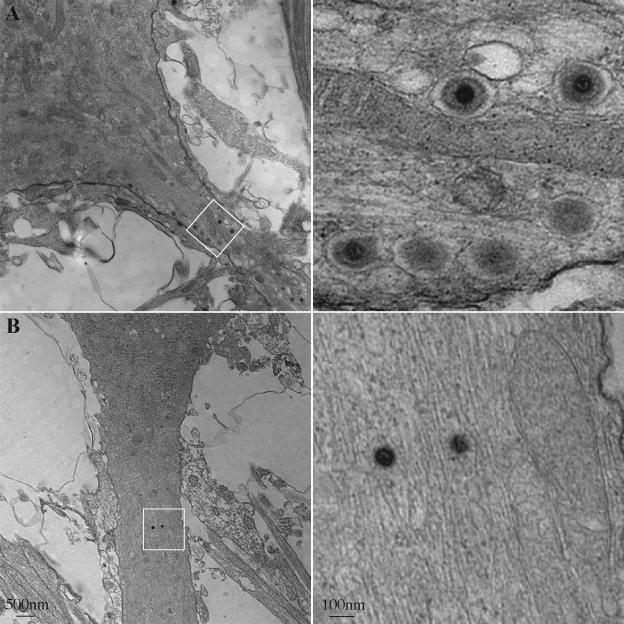
The molecular mechanisms responsible for long-distance, directional spread of alphaherpesvirus infections via axons of infected neurons are poorly understood. We describe the use of red and green fluorescent protein (GFP) fusions to capsid and tegument components, respectively, to visualize purified, single extracellular virions and axonal assemblies after pseudorabies virus (PRV) infection of cultured neurons. We observed heterogeneity in GFP fluorescence when GFP was fused to the tegument component VP22 in both single extracellular virions and discrete puncta in infected axons. This heterogeneity was observed in the presence or absence of a capsid structure detected by a fusion of monomeric red fluorescent protein to VP26. The similarity of the heterogeneous distribution of these fluorescent protein fusions in both purified virions and in axons suggested that tegument-capsid assembly and axonal targeting of viral components are linked. One possibility was that the assembly of extracellular and axonal particles containing the dually fluorescent fusion proteins occurred by the same process in the cell body. We tested this hypothesis by treating infected cultured neurons with brefeldin A, a potent inhibitor of herpesvirus maturation and secretion. Brefeldin A treatment disrupted the neuronal secretory pathway, affected fluorescent capsid and tegument transport in the cell body, and blocked subsequent entry into axons of capsid and tegument proteins. Electron microscopy demonstrated that in the absence of brefeldin A treatment, enveloped capsids entered axons, but in the presence of the inhibitor, unenveloped capsids accumulated in the cell body. These results support an assembly process in which PRV capsids acquire a membrane in the cell body prior to axonal entry and subsequent transport.


Figures

FIG. 1.
FIG. 1.
Expression and virion incorporation of fluorescent fusion proteins. PK15 cells were either mock infected or infected with the indicated PRV strains at an MOI of 10 for 16 h prior to preparation of whole-cell lysates or purified extracellular virions (as indicated). Western blot analysis was performed using monoclonal antibodies to gE, GFP, and RFP (A) or polyclonal antibodies to gC, VP22, and RFP (B). The migration positions of molecular mass markers are shown on the left (in kilodaltons). Be, Becker strain.
FIG. 2.
FIG. 2.
Flow cytometric analysis (FACS) scatter plot. The GFP-VP22 fusion protein is brighter than the VP22-GFP fusion during infection. PK15 cells were mock infected or infected with the indicated virus strains at an MOI of 10 for 6 h and analyzed for GFP autofluorescence by FACS analysis. Infection with PRV 178 expresses GFP fused to the amino terminus of VP22 (GFP-VP22), while 179 expresses GFP fused to the carboxy terminus of VP22 (VP22-GFP).
FIG. 3.
FIG. 3.
Transport of GFP-VP22 structures in the axonlike projections of differentiated rat PC12 cells. PC12 cells differentiated with NGF were infected with PRV 178 at an MOI of 10 for approximately 12 h prior to live-cell confocal microscopy in a heat-controlled environment. (A) The cell bodies and projections were visualized by differential interference contrast microscopy while the GFP autofluorescence, indicative of infection, was readily detectable by confocal microscopy. (B) A section of the projection (inset in panel A) was imaged by time-lapse microscopy. Several GFP puncta of varying emission intensity are visible. The transport properties of these structures during the imaging sequence also varied; two were moving (puncta 1 and 3), one was briefly stationary and then moved (punctum 4), and another remained stationary (punctum 2).
FIG. 4.
FIG. 4.
Visualization and quantitation of single fluorescent virion particles. (A) (a) Extracellular virions banded on a linear tartrate gradient (5 to 20%) are predominantly intact and monodispersed as demonstrated by electron microscopy of purified PRV 179 virions. (b) The fluorescence emission of PRV 181 particles isolated by a similar method were predominantly punctate and nonoverlapping. A higher-magnification view (b, inset) illustrates the heterogeneous fluorescence emission of the virus particles: the capsid fusion (c, red) is relatively constant, while the emission of the fluorescent tegument fusion (d, green) varies considerably from particle to particle. Heavy particles from the gradient (containing capsid) were identified by red fluorescence, while light particles (lacking capsid) were identified by the presence of green and the absence of red fluorescence. (e) At times, the red and green emissions of heavy particles appear juxtaposed or only partially overlapping (arrowheads). (B to D) Histogram plot of the green and red fluorescence emissions from 200 single heavy or light particles were quantitated. (B) The red fluorescence histogram plot of heavy particles is modeled by a Gaussian curve [χ2red = 1.47; df = 17; P2) ≅ 0.09]. (C) The green fluorescence histogram plot of light particles was best fit by a decaying exponential (exp.) curve [χ2green = 0.966; df = 14; P2) ≅ 0.5] with a mean of 1.44 × 10⁵ ± 0.1 × 10⁵ AU (top, gray bars). However, the green fluorescence of heavy particles was not modeled well by this curve and exhibited a mean fluorescence of 0.778 × 10⁵ ± 0.047 × 10⁵ AU, approximately half that of the mean of light particle distribution (bottom, white bars). (D) Rescaling of the green fluorescence of heavy particles (shown in panel C) by a constant factor allowed for a Poisson curve fit [χ2 = 5.055; df = 6; P2) > 0.4]. See Materials and Methods for more information on the distribution analysis. The fluorescence emissions of axonal puncta (the fluorescent equivalent of 20 heavy or light particles in axons) from the infected neuron shown in Fig. 7B are overlaid on the histograms as black arrows (with one arrow per axonal particle).
FIG. 5.
FIG. 5.
Time course of BFA treatment during infection. Dissociated rat SCG neurons were infected with PRV 180 at a high MOI for 15 h prior to fixation and detection of gE localization by indirect immunofluorescence and mRFP-VP26 autofluorescence. Infected neurons were untreated (A) or subjected to a concentration of 1 μg of BFA/ml from 12 (B), 9 (C), 6 (D), or 3 (E) h postinfection until the time of fixation. Examples of nuclei of BFA-treated cells are indicated with hollow arrowheads (A to E). Cytoplasmic accumulations of fluorescent capsid are indicated with arrows (B to E).
FIG. 6.
FIG. 6.
Prolonged BFA treatment results in cytoplasmic accumulations of the fluorescent capsid fusion protein and disruption of the secretory pathway. Dissociated rat SCG neurons were infected with PRV 180 at a high MOI followed by incubation for 12 h (A to C) or treatment with 2 μg of BFA/ml from 2 to 12 h postinfection (D to F) prior to fixation. Autofluorescence of the mRFP-VP26 fusion (red) and indirect immunofluorescence of gE (A and D), TGN38 (B and E), or Mannosidase II (green) (C and F) is shown. Axons containing fluorescent signals are indicated with solid arrowheads (A to C), while examples of nuclei of BFA-treated cells are indicated with hollow arrowheads (D to F). Cytoplasmic accumulations of fluorescent capsid and tegument are indicated with arrows (D to F). For each sample, a region of clustered neuronal cell bodies (white box) is shown at higher magnification.
FIG. 7.
FIG. 7.
Prolonged BFA treatment dramatically reduces the axonal entry of fluorescent capsid and tegument puncta. Dissociated rat SCG neurons were infected with PRV 181 at a high MOI and then subjected to incubation for 12 h (A and B), treatment with 2 μg of BFA/ml from 2 to 12 h postinfection (C and D), or treatment with BFA as before with recovery from 12 to 18 h postinfection (E and F) prior to detection of autofluorescence by confocal microscopy. Two planes of focus are shown: through the center of the nucleus, above axons (A, C, and E), or below the center of the cell body, through axons (B, D, and F). A region of axon containing fluorescent puncta (white box) is shown at a higher magnification (inset, lower left) (B, D, and F), while a cytoplasmic accumulation of fluorescent capsid and tegument is indicated with an arrow (C).
FIG. 8.
FIG. 8.
Ultrastructure of the BFA-induced accumulation of virus structures in the cytoplasm of infected neurons. Dissociated rat SCG neurons were infected with PRV 180 at a high MOI followed by incubation for 12 h (A), treatment with 2 μg of BFA/ml from 2 to 12 h postinfection (B) or treatment with BFA as before with recovery from 12 to 18 h postinfection (C) prior to fixation and processing for transmission electron microscopy. For each sample, a region of the neuronal cell body (left, white box) is shown at a higher magnification (right). N indicates the nucleus.
FIG. 9.
FIG. 9.
Enveloped virus particles are restricted from axons following the BFA treatment of infected neurons. Dissociated rat SCG neurons were infected with PRV 180 at a high MOI followed by incubation for 12 h (A) or treatment with 2 μg of BFA/ml from 2 to 12 h postinfection (B) prior to fixation and processing for transmission electron microscopy. A proximal region (A) or more distal region (B) of the axonal projection (left, white box) is shown at a higher magnification (right).

References

    1. Baines, J. D., R. J. Jacob, L. Simmerman, and B. Roizman. 1995. The herpes simplex virus 1 UL11 proteins are associated with cytoplasmic and nuclear membranes and with nuclear bodies of infected cells. J. Virol. 69:825-833. - PMC - PubMed
    1. Banfield, B. W., J. D. Kaufman, J. A. Randall, and G. E. Pickard. 2003. Development of pseudorabies virus strains expressing red fluorescent proteins: new tools for multisynaptic labeling applications. J. Virol. 77:10106-10112. - PMC - PubMed
    1. Baron, M. D., and H. Garoff. 1990. Mannosidase II and the 135-kDa Golgi-specific antigen recognized monoclonal antibody 53FC3 are the same dimeric protein. J. Biol. Chem. 265:19928-19931. - PubMed
    1. Bearer, E. L., X. O. Breakefield, D. Schuback, T. S. Reese, and J. H. LaVail. 2000. Retrograde axonal transport of herpes simplex virus: evidence for a single mechanism and a role for tegument. Proc. Natl. Acad. Sci. USA 97:8146-8150. - PMC - PubMed
    1. Bestvater, F., T. A. Knoch, J. Langowski, and E. Spiess. 2002. Construct conversions caused by simultaneous co-transfection: “GFP-walking.” BioTechniques 32:844-850. - PubMed

Publication types

MeSH terms

LinkOut - more resources