

Analysis of human immunodeficiency virus cytopathicity by using a new method for quantitating viral dynamics in cell culture
- PMID: 15767404
- PMCID: PMC1061548
- DOI: 10.1128/JVI.79.7.4025-4032.2005
Analysis of human immunodeficiency virus cytopathicity by using a new method for quantitating viral dynamics in cell culture
Abstract
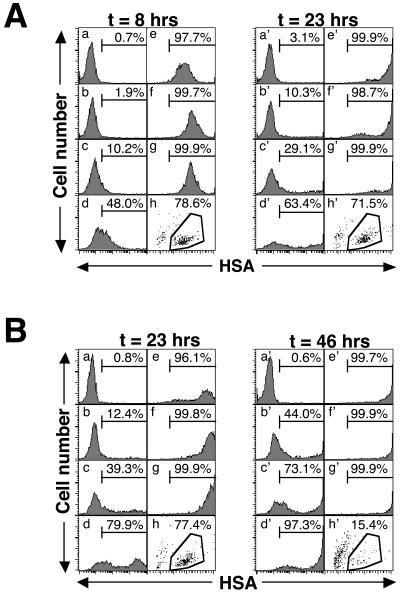
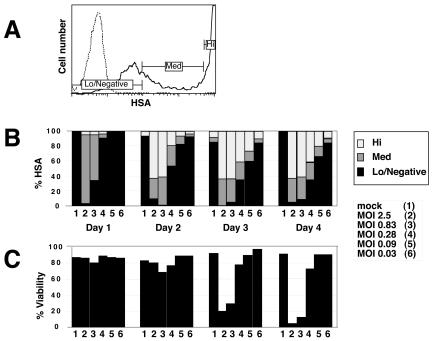
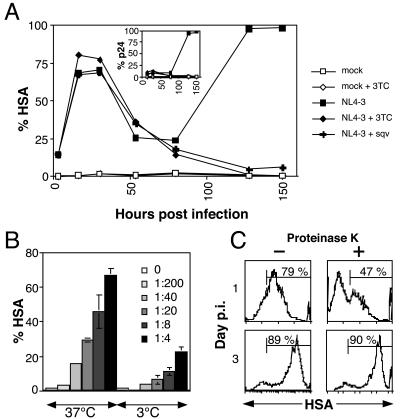
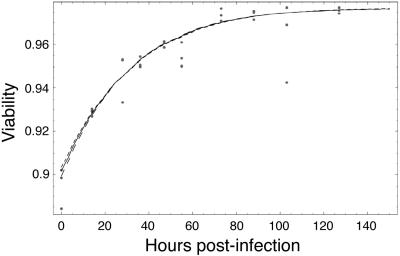
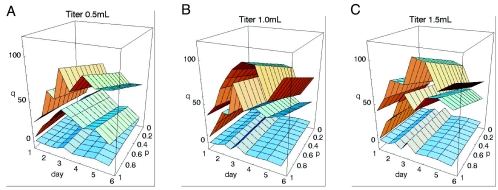
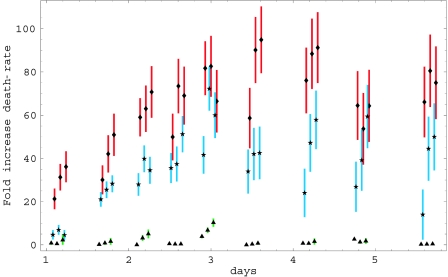
Human immunodeficiency virus (HIV) causes complex metabolic changes in infected CD4(+) T cells that lead to cell cycle arrest and cell death by necrosis. To study the viral functions responsible for deleterious effects on the host cell, we quantitated the course of HIV type 1 infection in tissue cultures by using flow cytometry for a virally encoded marker protein, heat-stable antigen (HSA). We found that HSA appeared on the surface of the target cells in two phases: passive acquisition due to association and fusion of virions with target cells, followed by active protein expression from transcription of the integrated provirus. The latter event was necessary for decreased target cell viability. We developed a general mathematical model of viral dynamics in vitro in terms of three effective time-dependent rates: those of cell proliferation, infection, and death. Using this model we show that the predominant contribution to the depletion of viable target cells results from direct cell death rather than cell cycle blockade. This allows us to derive accurate bounds on the time-dependent death rates of infected cells. We infer that the death rate of HIV-infected cells is 80 times greater than that of uninfected cells and that the elimination of the vpr protein reduces the death rate by half. Our approach provides a general method for estimating time-dependent death rates that can be applied to study the dynamics of other viruses.
Figures
Similar articles
-
Vpr cytopathicity independent of G2/M cell cycle arrest in human immunodeficiency virus type 1-infected CD4+ T cells.J Virol. 2007 Sep;81(17):8878-90. doi: 10.1128/JVI.00122-07. Epub 2007 Jun 6. J Virol. 2007. PMID: 17553871 Free PMC article.
-
Genetic recombination of human immunodeficiency virus type 1 in one round of viral replication: effects of genetic distance, target cells, accessory genes, and lack of high negative interference in crossover events.J Virol. 2005 Feb;79(3):1666-77. doi: 10.1128/JVI.79.3.1666-1677.2005. J Virol. 2005. PMID: 15650192 Free PMC article.
-
Human immunodeficiency virus type 1 Vpr induces DNA replication stress in vitro and in vivo.J Virol. 2006 Nov;80(21):10407-18. doi: 10.1128/JVI.01212-06. Epub 2006 Sep 6. J Virol. 2006. PMID: 16956949 Free PMC article.
-
Evidence for a cytopathogenicity determinant in HIV-1 Vpr.Proc Natl Acad Sci U S A. 2002 Jul 9;99(14):9503-8. doi: 10.1073/pnas.142313699. Epub 2002 Jul 1. Proc Natl Acad Sci U S A. 2002. PMID: 12093916 Free PMC article.
-
Could Nef and Vpr proteins contribute to disease progression by promoting depletion of bystander cells and prolonged survival of HIV-infected cells?Biochem Biophys Res Commun. 2000 Jan 27;267(3):677-85. doi: 10.1006/bbrc.1999.1708. Biochem Biophys Res Commun. 2000. PMID: 10673351 Review.
Cited by
-
Multi-scale modeling of HIV infection in vitro and APOBEC3G-based anti-retroviral therapy.PLoS Comput Biol. 2012 Feb;8(2):e1002371. doi: 10.1371/journal.pcbi.1002371. Epub 2012 Feb 9. PLoS Comput Biol. 2012. PMID: 22346743 Free PMC article.
-
HIV dynamics with multiple infections of target cells.Proc Natl Acad Sci U S A. 2005 Jun 7;102(23):8198-203. doi: 10.1073/pnas.0407498102. Epub 2005 May 31. Proc Natl Acad Sci U S A. 2005. PMID: 15928092 Free PMC article.
-
Quantification system for the viral dynamics of a highly pathogenic simian/human immunodeficiency virus based on an in vitro experiment and a mathematical model.Retrovirology. 2012 Feb 25;9:18. doi: 10.1186/1742-4690-9-18. Retrovirology. 2012. PMID: 22364292 Free PMC article.
-
Quantifying T lymphocyte turnover.J Theor Biol. 2013 Jun 21;327:45-87. doi: 10.1016/j.jtbi.2012.12.025. Epub 2013 Jan 9. J Theor Biol. 2013. PMID: 23313150 Free PMC article.
-
Human genetic approaches to diseases of lymphocyte activation.Immunol Res. 2009;43(1-3):8-14. doi: 10.1007/s12026-008-8045-x. Immunol Res. 2009. PMID: 18795237 Free PMC article.
References
-
- Ameisen, J. C., and A. Capron. 1991. Cell dysfunction and depletion in AIDS: the programmed cell death hypothesis. Immunol. Today 12:102-105. - PubMed
-
- Bartz, S. R., and M. A. Vodicka. 1997. Production of high-titer human immunodeficiency virus type 1 pseudotyped with vesicular stomatitis virus glycoprotein. Methods 12:337-342. - PubMed
Publication types
MeSH terms
Substances
Grants and funding
LinkOut - more resources
Full Text Sources
Other Literature Sources
Research Materials
