. 2005 Apr;79(7):4460-9.
doi: 10.1128/JVI.79.7.4460-4469.2005.

The alpha/beta interferon response controls tissue tropism and pathogenicity of poliovirus

Affiliations

The alpha/beta interferon response controls tissue tropism and pathogenicity of poliovirus

Miki Ida-Hosonuma et al. J Virol. 2005 Apr.

Abstract

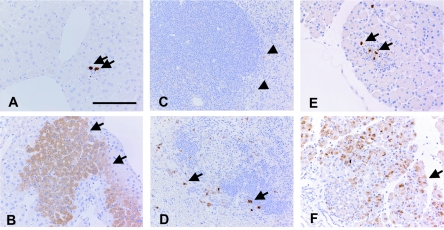
Poliovirus selectively replicates in neurons in the spinal cord and brainstem, although poliovirus receptor (PVR) expression is observed in both the target and nontarget tissues in humans and transgenic mice expressing human PVR (PVR-transgenic mice). We assessed the role of alpha/beta interferon (IFN) in determining tissue tropism by comparing the pathogenesis of the virulent Mahoney strain in PVR-transgenic mice and PVR-transgenic mice deficient in the alpha/beta IFN receptor gene (PVR-transgenic/Ifnar knockout mice). PVR-transgenic/Ifnar knockout mice showed increased susceptibility to poliovirus. After intravenous inoculation, severe lesions positive for the poliovirus antigen were detected in the liver, spleen, and pancreas in addition to the central nervous system. These results suggest that the alpha/beta IFN system plays an important role in determining tissue tropism by protecting nontarget tissues that are potentially susceptible to infection. We subsequently examined the expression of IFN and IFN-stimulated genes (ISGs) in the PVR-transgenic mice. In the nontarget tissues, ISGs were expressed even in the noninfected state, and the expression level increased soon after poliovirus infection. On the contrary, in the target tissues, ISG expression was low in the noninfected state and sufficient response after poliovirus infection was not observed. The results suggest that the unequal IFN response is one of the important determinants for the differential susceptibility of tissues to poliovirus. We consider that poliovirus replication was observed in the nontarget tissues of PVR-transgenic/Ifnar knockout mice because the IFN response was null in all tissues.


Figures

FIG. 1.
FIG. 1.
Comparison of poliovirus titers in tissues of nontransgenic, PVR-transgenic, and PVR-transgenic/Ifnar knockout mice. The mice were inoculated intravenously with 2 × 10⁷ PFU of poliovirus type 1 Mahoney strain. The tissues of nontransgenic mice (hatched bars), PVR-transgenic mice (open bars), and PVR-transgenic/Ifnar knockout mice (solid bars) were separated on day 3 p.i., and virus titers were determined by a plaque assay. The values represent the mean virus titer + standard deviation of six mice. The asterisk indicates that the values were below the limit of detection (2.0 log10 PFU/g).
FIG. 2.
FIG. 2.
Immunohistochemical detection of poliovirus antigen in infected mice. Poliovirus antigens were detected in PVR-transgenic (A, C, and E) and PVR-transgenic/Ifnar knockout (B, D, and E) mice with a rabbit polyclonal antibody recognizing the poliovirus capsid antigen. The mice were intravenously inoculated with 2 × 10⁷ PFU of poliovirus. (A) Liver of the PVR-transgenic mice on day 1 p.i. Poliovirus antigen-positive cells, indicated by arrows, were focally observed with slight cellular infiltration around the infected cell. (B) Liver of PVR-transgenic/Ifnar knockout mice on day 1 p.i. Hepatic cells positive for poliovirus were observed in a zonal pattern. (C) Spleen of PVR-transgenic mice on day 1 p.i. A few very weakly stained cells are observed in the marginal zone, indicated by arrowheads. (D) Spleen of PVR-transgenic/Ifnar knockout mice on day 1 p.i. Many poliovirus antigen-positive large cells are localized in the marginal zone. The cells were identified as macrophages on the basis of the detection of CD11. (E) Pancreas of PVR-transgenic mice on day 3 p.i. A small cluster of cells positive for poliovirus antigen was observed in the lobulus in association with a slight inflammatory reaction. The poliovirus antigen was observed constantly in all mice. (F) Pancreas of PVR-transgenic/Ifnar knockout mice on day 3 p.i. Numerous acinar cells positive for the poliovirus antigen were distributed in many lobuli of the pancreas. Only a few poliovirus antigen-positive cells were observed in Langerhans' islets in the bottom left. (A) Bar, 125 μm.
FIG. 3.
FIG. 3.
Serum ALT and amylase activities in infected mice. The mice were inoculated intravenously with 2 × 10⁷ PFU of poliovirus. The sera of nontransgenic (hatched bars), PVR-transgenic (open bars), and PVR-transgenic/Ifnar knockout (solid bars) mice were collected on day 3 p.i., and their ALT activity (A) and amylase activity (B) were determined. The mean values plus standard deviation of four mice are shown. The asterisks indicate that the values are significantly higher than those observed in the nontransgenic C57BL/6 mice (P < 0.05, t test).
FIG. 4.
FIG. 4.
Viremia in PVR-transgenic mice and PVR-transgenic/Ifnar knockout mice. Poliovirus (103 PFU) was inoculated intraperitoneally. Plasma from three or four infected mice was collected at the indicated day p.i., after which the virus titer in the plasma was determined. Open circles, PVR-transgenic mice; solid circles, PVR-transgenic/Ifnar knockout mice. Note that the virus titer in the PVR-transgenic/Ifnar knockout mice is very high. The data for PVR-transgenic/Ifnar knockout mice on days 5 and 7 p.i. were not available because all mice died on the fourth day after inoculation.
FIG. 5.
FIG. 5.
Expression of IFN-β and ISGs in PVR-transgenic mice. The expression levels of IFN-β and ISG mRNAs in noninfected PVR-transgenic mice and PVR-transgenic mice infected intravenously with poliovirus (2 × 10⁷ PFU) were determined by real-time quantitative PCR. The amounts of IFN-β (A), OAS1a (B), OAS1g (C), OAS2 (D), OAS3 (E), OASL2 (F), and protein kinase R (G) mRNAs normalized to 107 copies of 18S rRNA are shown. Open bars, gray solid bars, and black solid bars indicate the results for noninfected mice, infected mice at 1 day p.i., and infected mice at 3 days p.i., respectively. The mean values for three to six mice are indicated. The numbers above each figure indicate values that could not be represented within the figures. Note that the open bars in A are not visible because IFN-β mRNA expression in the noninfected mice was very low.
FIG. 6.
FIG. 6.
Expression of RIG-I, helicard, and IRF-7 mRNAs in PVR-transgenic mice. The expression levels of RIG-I, helicard, and IRF-7 mRNAs of noninfected PVR-transgenic mice and PVR-transgenic mice infected intravenously with poliovirus (2 × 10⁷ PFU) were determined by real-time quantitative PCR. The mean values for three mice are indicated. The amounts of RIG-I (A), helicard (B), and IRF-7 (C) mRNAs were determined. Open bars, gray solid bars, and black solid bars indicate the results of noninfected mice, infected mice at 1 day p.i., and infected mice at 3 days p.i., respectively. The amounts of mRNA per 107 copies of 18S rRNA are shown.
FIG. 7.
FIG. 7.
Induction of mRNAs for OAS1a (A) and RIG-I (B) after poly(I:C) treatment. PVR-transgenic mice was administered poly(I:C) (solid bars) or mock treated (open bars). RNA was prepared from the mice 1 day after administration. The amounts of RNA were determined by real-time quantitative PCR. (C) Survival of infected mice. PVR-transgenic mice administered poly(I:C) (solid circles) or mock treated (open circles) (13 mice each) were challenged intracerebrally with 104 PFU of poliovirus. Mice were observed for 3 weeks. The survival rate of poly(I:C)-treated mice was significantly higher than that of mock-treated mice (P < 0.05, log-rank test).

References

    1. Asada-Kubota, M., T. Ueda, M. Shimada, K. Takeda, and T. Sokawa. 1995. Distribution of immunoreactive 2′, 5′-oligoadenylate synthetase in mouse digestive tract. J. Interferon Cytokine Res. 15:863-867. - PubMed
    1. Bodian, D. 1949. Histopathologic basis of clinical findings in poliomyelitis. Am. J. Med. 6:563-578. - PubMed
    1. Bodian, D. 1954. Viremia in experimental poliomyelitis. I. General aspects of infection after intravascular inoculation with strains of high and of low invasiveness. Am. J. Hyg. 60:339-357. - PubMed
    1. Bodian, D. 1955. Emerging concept of poliomyelitis infection. Science 12:105-108. - PubMed
    1. Bodian, D. 1956. Poliovirus in chimpanzee tissues after virus feeding. Am. J. Hyg. 64:181-197. - PubMed

Publication types

MeSH terms