

FRET measurements of cell-traction forces and nano-scale clustering of adhesion ligands varied by substrate stiffness
- PMID: 15767572
- PMCID: PMC555469
- DOI: 10.1073/pnas.0405873102
FRET measurements of cell-traction forces and nano-scale clustering of adhesion ligands varied by substrate stiffness
Abstract
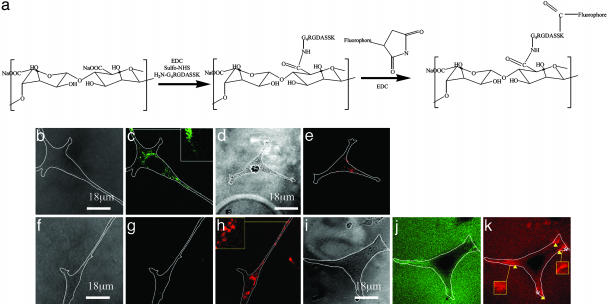
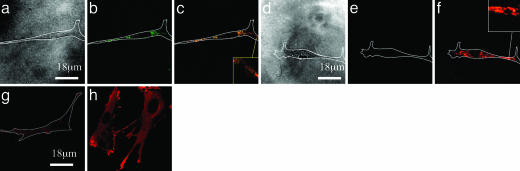
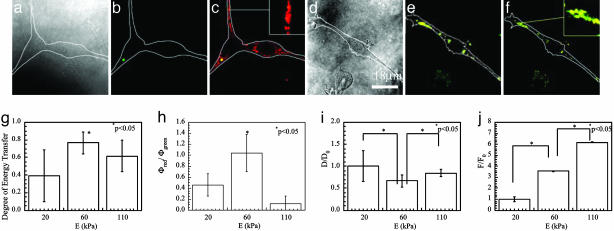
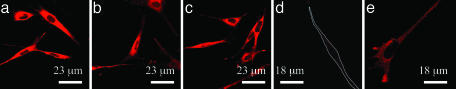
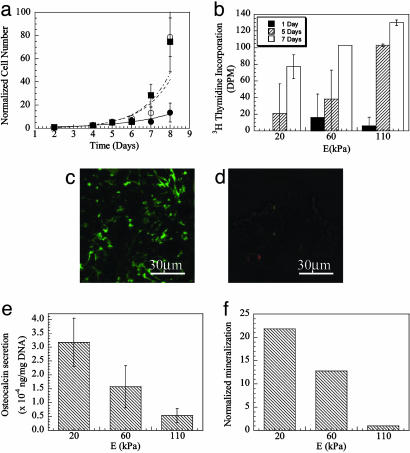
The mechanical properties of cell adhesion substrates regulate cell phenotype, but the mechanism of this relation is currently unclear. It may involve the magnitude of traction force applied by the cell, and/or the ability of the cells to rearrange the cell adhesion molecules presented from the material. In this study, we describe a FRET technique that can be used to evaluate the mechanics of cell-material interactions at the molecular level and simultaneously quantify the cell-based nanoscale rearrangement of the material itself. We found that these events depended on the mechanical rigidity of the adhesion substrate. Furthermore, both the proliferation and differentiation of preosteoblasts (MC3T3-E1) correlated to the magnitude of force that cells generate to cluster the cell adhesion ligands, but not the extent of ligand clustering. Together, these data demonstrate the utility of FRET in analyzing cell-material interactions, and suggest that regulation of phenotype with substrate stiffness is related to alterations in cellular traction forces.
Figures
Similar articles
-
Topographical control of multiple cell adhesion molecules for traction force microscopy.Integr Biol (Camb). 2014 Mar;6(3):357-65. doi: 10.1039/c3ib40127h. Epub 2014 Jan 17. Integr Biol (Camb). 2014. PMID: 24441735
-
Quantifying the relation between adhesion ligand-receptor bond formation and cell phenotype.Proc Natl Acad Sci U S A. 2006 Dec 5;103(49):18534-9. doi: 10.1073/pnas.0605960103. Epub 2006 Nov 21. Proc Natl Acad Sci U S A. 2006. PMID: 17124175 Free PMC article.
-
Quantitative methods for analyzing cell-cell adhesion in development.Dev Biol. 2015 May 1;401(1):165-74. doi: 10.1016/j.ydbio.2014.11.002. Epub 2014 Nov 18. Dev Biol. 2015. PMID: 25448695 Review.
-
Co-regulation of cell adhesion by nanoscale RGD organization and mechanical stimulus.J Cell Sci. 2002 Apr 1;115(Pt 7):1423-33. doi: 10.1242/jcs.115.7.1423. J Cell Sci. 2002. PMID: 11896190
-
Fluorescent resonance energy transfer: A tool for probing molecular cell-biomaterial interactions in three dimensions.Biomaterials. 2007 May;28(15):2424-37. doi: 10.1016/j.biomaterials.2007.01.023. Epub 2007 Jan 16. Biomaterials. 2007. PMID: 17270268 Free PMC article. Review.
Cited by
-
Microscale Interrogation of 3D Tissue Mechanics.Front Bioeng Biotechnol. 2019 Dec 17;7:412. doi: 10.3389/fbioe.2019.00412. eCollection 2019. Front Bioeng Biotechnol. 2019. PMID: 31921816 Free PMC article. Review.
-
Designing degradable hydrogels for orthogonal control of cell microenvironments.Chem Soc Rev. 2013 Sep 7;42(17):7335-72. doi: 10.1039/c3cs60040h. Epub 2013 Apr 22. Chem Soc Rev. 2013. PMID: 23609001 Free PMC article. Review.
-
Extracellular matrix stiffness determines DNA repair efficiency and cellular sensitivity to genotoxic agents.Sci Adv. 2020 Sep 11;6(37):eabb2630. doi: 10.1126/sciadv.abb2630. Print 2020 Sep. Sci Adv. 2020. PMID: 32917705 Free PMC article.
-
Substrate elasticity modulates TGF beta stimulated re-differentiation of expanded human articular chondrocytes.Drug Deliv Transl Res. 2012 Oct;2(5):351-62. doi: 10.1007/s13346-012-0080-4. Drug Deliv Transl Res. 2012. PMID: 25787174
-
Submicron-Sized In Situ Osmotic Pressure Sensors for In Vitro Applications in Biology.Adv Healthc Mater. 2023 Apr;12(9):e2202373. doi: 10.1002/adhm.202202373. Epub 2023 Jan 13. Adv Healthc Mater. 2023. PMID: 36541931 Free PMC article.
References
-
- Galbraith, C. & Sheetz, M. P. (1998) Curr. Opin. Cell Biol. 10, 566–571. - PubMed
-
- Huang, S. & Ingber, D. E. (1999) Nat. Cell Biol. 1, E131–E138. - PubMed
-
- Geiger, B., Bershadsky, A., Pankov, R. & Yamada, K. M. (2001) Nat. Rev. Mol. Cell. Biol. 2, 793–805. - PubMed
-
- Wang, H. B., Dembo, M. & Wang, Y. L. (2000) Am. J. Physiol. 279, C1345–C1350. - PubMed
Publication types
MeSH terms
Substances
Grants and funding
LinkOut - more resources
Full Text Sources
Other Literature Sources
