. 2005 Mar 22;102(12):4282-7.
doi: 10.1073/pnas.0407499102. Epub 2005 Mar 14.

Local conformational fluctuations can modulate the coupling between proton binding and global structural transitions in proteins

Affiliations

Local conformational fluctuations can modulate the coupling between proton binding and global structural transitions in proteins

Steven T Whitten et al. Proc Natl Acad Sci U S A. .

Abstract

Local conformational fluctuations in proteins can affect the coupling between ligand binding and global structural transitions. This finding was established by monitoring quantitatively how the population distribution in the ensemble of microstates of staphylococcal nuclease was affected by proton binding. Analysis of acid unfolding and proton-binding data with an ensemble-based model suggests that local fluctuations: (i) can be effective modulators of ligand-binding affinities, (ii) are important determinants of the cooperativity of ligand-driven global structural transitions, and (iii) are well represented thermodynamically as local unfolding processes. These studies illustrate how an ensemble-based description of proteins can be used to describe quantitatively the interdependence of local conformational fluctuations, ligand-binding processes, and global structural transitions. This level of understanding of the relationship between conformation, energy, and dynamics is required for a detailed mechanistic understanding of allostery, cooperativity, and other complex functional and regulatory properties of macromolecules.


Figures
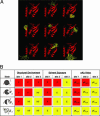
Fig. 1.
Fig. 1.
Schematic representation of the SNase ensemble calculated for thecorex/best algorithm. (A) Nine of the most probable conformational states (of ≈106) of the SNase ensemble, modeled as described in ref. . Each microstate exhibits dual structural character and consists of a mixture of regions that are considered to be native-like (red) and regions that are treated thermodynamically as unfolded (yellow). Molecular diagrams in this figure were made by using the program pymol (65). (B) Ensemble model used to describe quantitatively the coupling between local unfolding energetics and the energetics of proton binding. Depicted are the proton titration properties of a hypothetical protein (gray circle) that has only three titratable groups (dots) and whose conformational ensemble contains only four microstates: a fully folded, two partially folded, and a fully unfolded state. Unfolded segments of the protein are depicted as randomly curved lines. The small dots represent the individual titratable groups of the protein: sites 1, 2, and 3. Each individual proton-binding site can reside in a folded (F) or an unfolded (NF) region, and they can be exposed to solvent (E) or protected from solvent (P). The pKa value of each titratable group in each state was assigned according to the degree of solvent exposure of the titratable atoms. Groups that were protected from solvent were assigned the pKa values calculated with Poisson–Boltzmann continuum electrostatics method (pKa,FD). Groups that were exposed to solvent were assigned pKa values identical to those observed in unfolded polypeptides (pKa,nf).
Fig. 2.
Fig. 2.
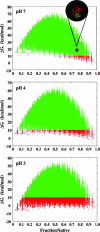
Relative stability (Gibbs free energy, ΔG) of each of the ≈106 microstates plotted as a function of the fraction native (number of residues in folded segments/total number of residues) at three different pH values (pH 7, 4, and 3). Each point corresponds to a particular microstate, and the ΔG values were calculated relative the fully folded state (i.e., the stability of the fully folded state in the ensemble is 0 at all pH values). To highlight the changing character of the ensemble induced by pH, all states with ΔG of <10 kcal/mol are shown in red, and those states with ΔG of >10 kcal/mol are shown in green.
Fig. 3.
Fig. 3.
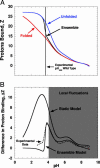
pH-induced modulation of the SNase ensemble. (A) Calculated pH dependence of the summed probability of all partially folded states in which 20% or fewer of the residues are unfolded (black), the summed probability of all states in which 80% or more of the residues are unfolded (blue), the probability of the fully folded state (red), and the summed probability of all other states of the ensemble (green). (B) Experimental acid unfolding of wild-type (WT) SNase monitored by pH titration of the intrinsic fluorescence of Trp-140 (24). The lines overlaid on the experimental data represent the ensemble-calculated pH-dependent unfolding of the protein. The relative extent of folding of the ensemble was calculated by 〈Fraction Native〉 = ∑i Fraction Nativei·P(pH)i. Also shown is the predicted acid unfolding transition based on pKa values calculated with Poisson–Boltzmann electrostatics (58). Regions shaded gray in A and B indicate conditions wherein the conformational excursions are dominated by local fluctuations.
Fig. 4.
Fig. 4.
Proton-binding properties of the SNase ensemble. (A) Calculated proton titration of the ensemble (black lines), the fully native state (red), and the fully unfolded state (blue) for SNase (solid lines). The proton-binding curves were all zeroed at pH 9.0 to facilitate comparison of the different curves. The vertical line describes the midpoint of the pH-induced transition measured experimentally (Fig. 3B). (B) Experimental and calculated preferential proton binding of the fully unfolded state relative to the fully native state and to the ensemble of SNase. The difference in proton binding between GdnHCl unfolded protein (measured in 6 M GdnHCl/100 mM KCl at 20°C) and native protein (100 mM KCl at 20°C) is shown by the dashed lines (24). The curve marked “Static Model” reflects the difference between proton binding of the fully unfolded state achieved in 6 M GdnHCl and the fully native state, calculated with the pKa values obtained with continuum electrostatic methods (FDPB) applied to the x-ray structure (Protein Data Bank ID code 1STN). The curve marked “Ensemble Model” represents the difference in proton binding between the fully unfolded state and the ensemble. Gray shading is as described in Fig. 3.
Fig. 5.
Fig. 5.
Microscopic origins of the pH-dependent stability of SNase. (A) Global coupling parameters (GCP) were used to identify coupling between proton binding and global conformational stability: GCP(pH)j = |Z(pH)f,j – 〈Z(pH)j〉| × |Z(pH)nf,j – 〈Z(pH)j〉|. The values Z(pH)f,j and Z(pH)nf,j are the pH-dependent protonation states of residue j in the fully folded and fully unfolded states, respectively. 〈Z(pH)j〉 is the ensemble-weighted value, equal to ∑i Z(pH)i,j·P(pH)i. GCP of >0 identifies residues whose titration is affected by the pH-dependent redistribution of the conformational ensemble (i.e., their titration is coupled to the acid unfolding). GCP = 0 identifies residues whose titration is not affected by the pH-induced redistribution of the ensemble. The high GCP values are concentrated near pHmid because they arise when the titration of a residue is coupled to the global shift in the equilibrium population of the ensemble. Only a subset of all ionizable residues (E10, D19, D21, E75, D77, D83, D95, E101, E129, and E135) show high GCP values. These residues are in folded segments in the majority of the highly probable states under native conditions, are predicted to govern the energetics of the acid-unfolding reaction, and are responsible for the cooperative character of this transition. (B) The effects of point mutations on the stability of SNase at pH 7 were measured by GdnHCl-induced unfolding (25). ΔΔGpH7 describes the difference in stability between the WT protein and the Glu → Ala or Asp → Ala mutants. Also included in this plot are the four His → Ala point mutants. pHmid refers to the pH at the midpoint of the acid-induced unfolding, monitored by intrinsic fluorescence (25). The black curve describes the expected dependence of pHmid on global stability, calculated as ΔG(pH) =∫Δν(pH)WT∂pH. For variants that fall on or close to the curve (blue), the substituted amino acid is not coupled to the global unfolding transition. For variants that do not fall on this line (red), titration at the substituted site is coupled to the global structural transition. Comparison of A and B indicates that the substitutions that fall away from the curve are also the ones that are calculated to contribute to ΔZ in the WT ensemble (see Fig. 4B) and thus determine the pH-dependent energetics of SNase.

Similar articles

Cited by

References

    1. Englander, S. W. (2000) Annu. Rev. Biophys. Biomol. Struct. 29, 213–238. - PubMed
    1. Bai, Y., Sosnick, T. R., Mayne, L. & Englander, S. W. (1995) Science 269, 192–197. - PMC - PubMed
    1. Swint-Kruse, L. & Robertson, A. D. (1996) Biochemistry 35, 171–180. - PubMed
    1. Hvidt, A. & Nielsen, S. O. (1966) Adv. Protein Chem. 21, 287–386. - PubMed
    1. Chamberlain, A. K., Handel. T. & Marqusee, S. (1996) Nat. Struct. Biol. 3, 782–787. - PubMed

Publication types