. 2005 Mar 22;102(12):4448-52.
doi: 10.1073/pnas.0408871102. Epub 2005 Mar 14.

Suppression of viral infectivity through lethal defection

Affiliations

Suppression of viral infectivity through lethal defection

Ana Grande-Pérez et al. Proc Natl Acad Sci U S A. .

Abstract

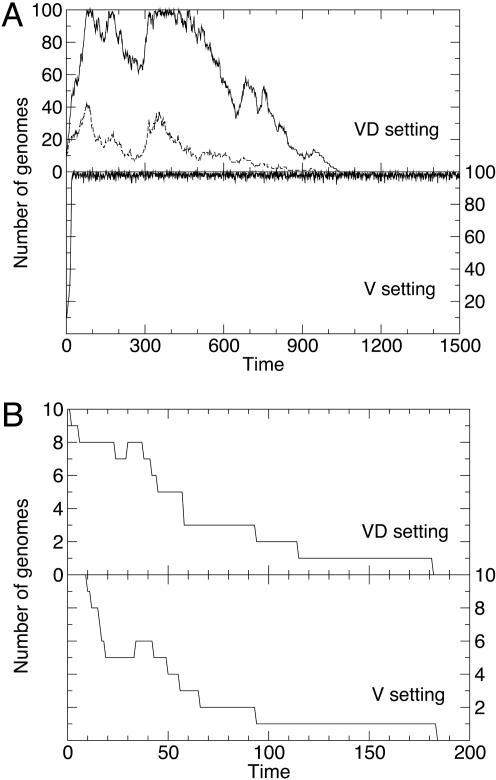
RNA viruses replicate with a very high error rate and give rise to heterogeneous, highly plastic populations able to adapt very rapidly to changing environments. Viral diseases are thus difficult to control because of the appearance of drug-resistant mutants, and it becomes essential to seek mechanisms able to force the extinction of the quasispecies before adaptation emerges. An alternative to the use of conventional drugs consists in increasing the replication error rate through the use of mutagens. Here, we report about persistent infections of lymphocytic choriomeningitis virus treated with fluorouracil, where a progressive debilitation of infectivity leading to eventual extinction occurs. The transition to extinction is accompanied by the production of large amounts of RNA, indicating that the replicative ability of the quasispecies is not strongly impaired by the mutagen. By means of experimental and theoretical approaches, we propose that a fraction of the RNA molecules synthesized can behave as a defective subpopulation able to drive the viable class extinct. Our results lead to the identification of two extinction pathways, one at high amounts of mutagen, where the quasispecies completely loses its ability to infect and replicate, and a second one, at lower amounts of mutagen, where replication continues while the infective class gets extinct because of the action of defectors. The results bear on a potential application of increased mutagenesis as an antiviral strategy in that low doses of a mutagenic agent may suffice to drive persistent virus to extinction.


Figures

Fig. 1.
Fig. 1.
Quantification of the L genomic segment in the extinction of LCMV. Infectivity of virus in supernatants and cell fractions of LCMV incubated in the absence (A, control) or presence of 100 μg/ml 5-FU (B) were assayed on Vero cell monolayers. ic, intracellular; sn, supernatant. Total RNA from these samples was extracted with TRIzol (Invitrogen) and the RNA corresponding to the L genomic segment was quantified by two-step RT-PCR with the Fast Start DNA Master SYBR green I kit (Roche Applied Science) in a Light Cycler instrument (Roche Applied Science). Virus titers (circles) and RNA (squares) are expressed as total plaque-forming units and total molecules of L genomic RNA, respectively, for each sample. Error bars for selected points correspond to 1 SD from the average.
Fig. 2.
Fig. 2.
Relation between infectivity and mutation frequency for infections in the presence of 5-FU. Infectivity values (plaque-forming units per RNA molecule) were calculated by using the results of Fig. 1. The mutation frequency was determined after sequencing the region encompassing nucleotides 3654–4233. There is a critical mutation rate beyond which infectivity gets extinct. For the intracellular fraction of mutagenized samples, a number between 13 and 25 sequences was analyzed. The corresponding standard deviation for the mean number of mutations per sequence (SD) lies between 0.41 and 0.92. For supernatant fractions of mutagenized samples, the number of sequences analyzed varied between 7 and 15 (SD values between 0.38 and 1.20). In the control intracellular samples, we analyzed 13–15 sequences (SD values between 0.27 and 0.41). For control supernatant fractions, 20 sequences were analyzed at 24 h after infection in the intracellular fraction (SD = 0.31) and 19 sequences at 72 h after infection (SD = 0.54).
Fig. 3.
Fig. 3.
Dynamics of the model system at low and high amounts of mutagen m, illustrating the two different pathways to extinction. (A) Extinction due to the action of defectors. The curves show the number of genomes inside a model cell in the VD and V settings (with VD genomes or only V genomes, respectively), for m = 6 mutations per genome and replication cycle. In the VD setting, the total number of genomes (VD, full line) fluctuates broadly because of the decoupling between replicative ability and viability for each genome, which translates into a variable amount of V genomes (dashed line). Once V genomes disappear, replication is no longer possible, and the extinction of unviable (although replicative) genomes follows. In the V setting (lower plot), high numbers of viable genomes are maintained and extinction is not observed. (B) Extinction due to the loss of the replicative ability. At high amounts of mutagen (m = 20 in these plots), viability and replicative ability are simultaneously lost, extinction occurs readily, and no qualitative difference between the VD and V settings is observed. Time is measured in replication cycles. All simulations start with 10 viable particles of replicative ability r = 2. Other parameters values are P = 0.9, q = 0.05, R = 4, d = 0.02, and w = 0.5 for the setting VD.
Fig. 4.
Fig. 4.
Statistical behavior of the model system as a function of the average number of mutations per copy (m, horizontal axis). Two different regimes separated by the vertical dotted line at the critical amount of mutagen mc = 15 can be distinguished. (A) Average time to extinction. Diamonds stand for the V setting (with viable genomes only), stars stand for the VD setting (with VD genomes). In the V setting, there is no extinction for m < mc; in the VD setting, extinction occurs in finite time for any value of m. Above the critical value mc, both settings behave similarly, and extinction takes place in a few hundred replication cycles. (B) Average number of genomes present until extinction supervenes. Open squares correspond to the V setting. There is a clear transition from a full system to only few genomes present at m > mc. Solid symbols correspond to the VD setting. Defective (triangles) and V genomes (circles) coexist before extinction occurs in the phase m < mc. Above the transition, the behavior is comparable to the system without defective genomes (V). (C) Average replicative ability of the genomes (symbols are as in B). In all cases, the replicative ability of the genomes decreases monotonously with the increase in the amount of mutagen. In the VD setting, and for m > mc, defective genomes appear only rarely, and the average fitness of the viable genomes is just that of the initial population. The average replicative ability of the defective type lies always below that of the viable type, this being the result of the correlation between positive/negative changes in replicative ability and gain/loss of viability. In all images, each point represents an average over several thousand independent numerical simulations of the system. Parameter values are as in Fig. 3.

Similar articles

Cited by

References

    1. Earl, D. J. & Deem, M. W. (2004) Proc. Natl. Acad. Sci. USA 101, 11531–11536. - PMC - PubMed
    1. Domingo, E., Holland, J. J. (1988) in RNA Genetics, eds. Domingo, E., Holland, J. J. & Ahlquist, P. (CRC, Boca Raton, FL), Vol. 3, pp. 3–36.
    1. Biebricher, C. K. (1999) in Origin and Evolution of Viruses, eds. Domingo, E., Webster, R. K. & Holland, J. J. (Academic, San Diego), pp. 65–85.
    1. Eigen, M. & Schuster, P. (1977) Naturwissenschaften 64, 541–565. - PubMed
    1. Drake, J. W. & Holland, J. J. (1999) Proc. Natl. Acad. Sci. USA 96, 13910–13913. - PMC - PubMed

Publication types

MeSH terms

LinkOut - more resources