Comparative Study
. 2005 Mar 29;102(13):4672-7.
doi: 10.1073/pnas.0407860102. Epub 2005 Mar 15.

Termination of spiral waves during cardiac fibrillation via shock-induced phase resetting

Affiliations
Comparative Study

Termination of spiral waves during cardiac fibrillation via shock-induced phase resetting

Richard A Gray et al. Proc Natl Acad Sci U S A. .

Abstract

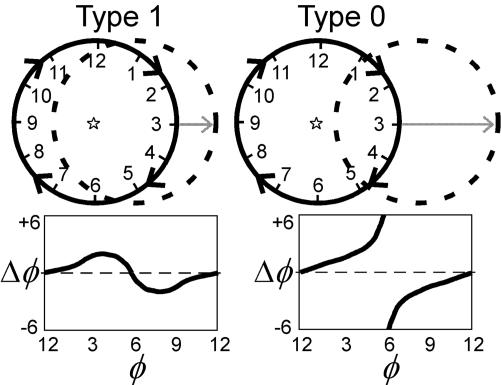
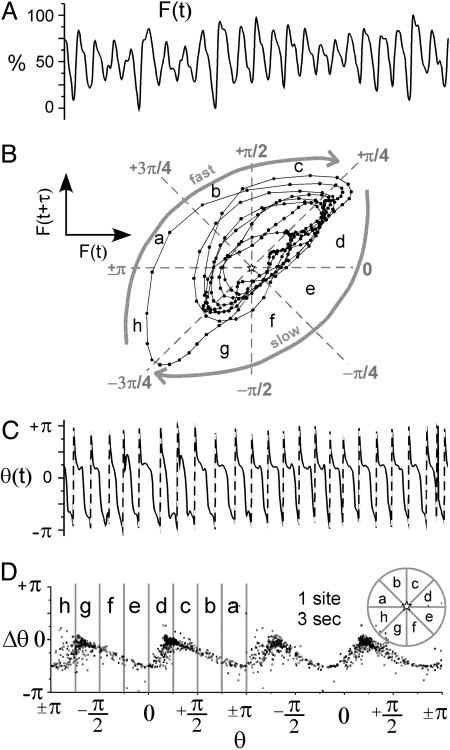
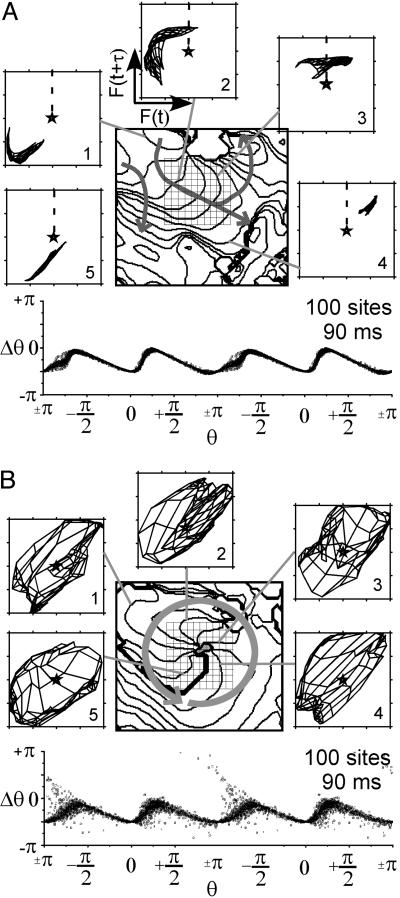
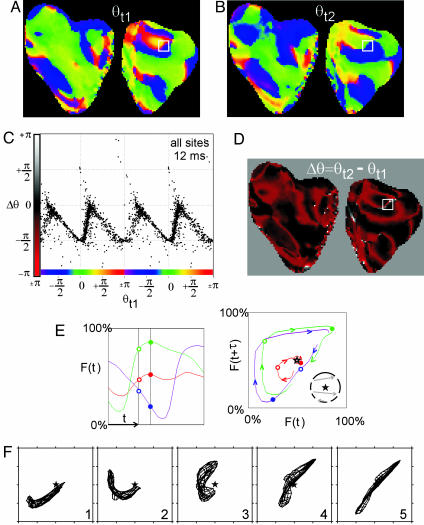
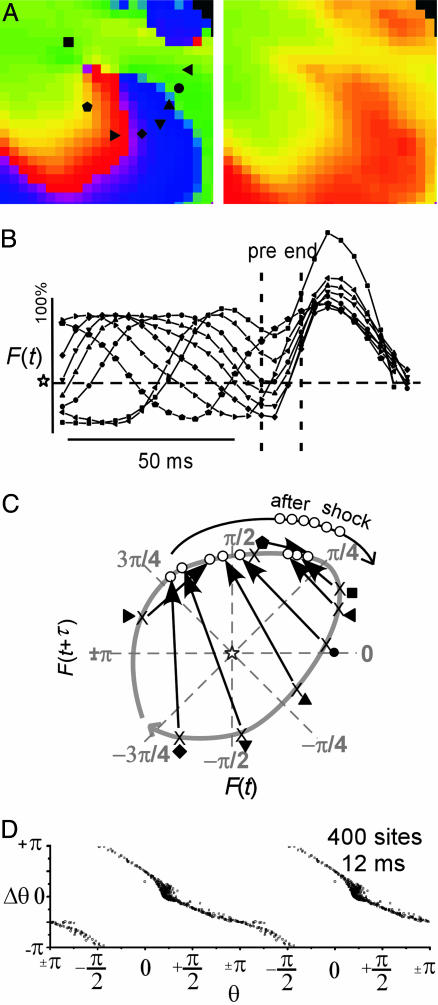
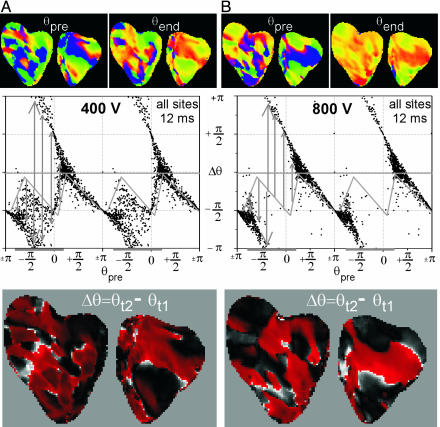
Multiple unstable spiral waves rotating around phase singularities (PSs) in the heart, i.e., ventricular fibrillation (VF), is the leading cause of death in the industrialized world. Spiral waves are ubiquitous in nature and have been extensively studied by physiologists, mathematicians, chemists, and biologists, with particular emphasis on their movement and stability. Spiral waves are not easy to terminate because of the difficulty of "breaking" the continuous spatial progression of phase around the PSs. The only means to stop VF (i.e., cardiac defibrillation) is to deliver a strong electric shock to the heart. Here, we use the similarities between spiral wave dynamics and limit cycle oscillators to characterize the spatio-temporal dynamics of VF and defibrillation via phase-resetting curves. During VF, only PSs, including their formation and termination, were associated with large phase changes. At low shock strengths, phase-resetting curves exhibited characteristics of weak (type 1) resetting. As shock strength increased, the number of postshock PSs decreased to zero coincident with a transition to strong (type 0) resetting. Our results indicate that shock-induced spiral wave termination in the heart is caused by altering the phase around the PSs, such that, depending on the preshock phase, sites are either excited by membrane depolarization (phase advanced) or exhibit slowed membrane repolarization (phase delay). Strong shocks that defibrillate break the continuity of phase around PSs by forcing the state of all sites to the fast portion of state space, thus quickly leading to a "homogeneity of state," subsequent global repolarization and spiral wave termination.


Figures

Fig. 1.
Fig. 1.
Weak and strong phase resetting using time encoding. Time-encoded phase (φ) is represented as the position of a hand on a clock. A weak stimulus causes a small perturbation in φ, resulting in type 1 resetting. A strong stimulus causes a large perturbation in φ, resulting in type 0 resetting. (Upper) Graphical illustration of type 1, weak (Left) and type 0, strong (Right) phase resetting; the original limit cycle trajectory is shown as a solid circle with a star indicating its origin; the “shifted” cycle is shown as a dashed circle. (Lower) The change in phase (Δφ) resulting from a stimulus versus the time when the stimulus is applied (φ), i.e., a PRC for type 1 (Left) and type 0 (Right) resetting.
Fig. 2.
Fig. 2.
VF (single site dynamics). (A) Fluorescence signal from a site on the surface of the heart, F(t), during 3 s of VF. (B) One second of fluorescence signal in A plotted in reconstructed state space, i.e., F(t + τ) versus F(t). (C) Phase signal, θ(t), computed from the signal in A using Eq. 1. The dashed lines indicate an artificial increase in phase caused by the cyclical nature of the atan function. (D) PRC generated from fluorescence signal in A. The PRC data are plotted twice to span two full cycles (4 π) as is typical for PRCs. The stars indicate the origin in state space, i.e., F50, F50; see Methods.
Fig. 3.
Fig. 3.
VF [state space dynamics of planar (A) and reentrant (B) propagation]. (A Upper and B Upper) Isochrone maps indicate the position of the wavefront every 8 ms during one beat. Arrows indicate the direction of propagation. (A Lower and B Lower) PRC generated from a 10 × 10 pixel region indicated by grid in the isochrone map. Fluorescence signals from this same region are plotted in reconstructed state space (numbers represent sequence and gray lines indicate the corresponding isochrone; dashed line indicates depolarization time).
Fig. 4.
Fig. 4.
Phase resetting during VF. (A and B) Phase maps from the surface of the pig heart (front surface on left, back surface on right) at time t1 (A) and time t2 (B); t2 - t1 = 12 ms. (C) PRC generated from all sites; Δθ plotted versus the phase at time t1, i.e., D plotted versus A, only every fourth point is plotted for clarity. (D) A map of the change in phase (Δθ) from time t1 to time t2, specifically, the phase map in B minus the phase map in A.(E) One hundred milliseconds of the fluorescence signal F(t) from sites ahead (green), behind (purple), and near (red) a line of block (within white box in A, B, and D). The black vertical bars indicate the time of the phase maps in A and B, i.e., t1 and t2.(Right) The same fluorescence signals plotted in reconstructed state space. The open circles indicate the values of F(t = t1), and filled circles represent values of F(t = t2). (F) Fluorescence signals from within the white box are plotted in reconstructed state space during the formation of a pair of PSs.
Fig. 5.
Fig. 5.
Shock-induced termination of a spiral wave. (A) Phase maps from a small (20 × 20 pixels) region containing a PS from the heart surface immediately before (Left) and after (Right) a 500-V shock. (B) Fluorescence signals, F(t), from the sites surrounding the PS before, during, and after the shock (symbols correspond to locations shown in A). (C) Shock-induced movement of sites surrounding the PS in reconstructed state space. The arrows indicate how these sites were shifted by the shock; the open circles represent the state immediately after the shock. (D) PRC generated from the data in A.
Fig. 6.
Fig. 6.
Phase resetting during defibrillation shocks. (A) Unsuccessful defibrillation resulting from a 400-V shock. (B) Successful defibrillation resulting from a 800-V shock. (A Top and B Top) Phase maps immediately preceding the shock, θpre, and at the end of the shock, θend.(A Middle and B Middle) The associated PRCs (i.e., Δθ versus θpre, where Δθ = θend - θpre) for all sites. The gray diagonal lines indicate the PRC during VF, the horizontal gray bars indicate the slow portion of the VF cycle, and the vertical gray bars indicate the shock-induced resetting. (A Bottom and B Bottom) The spatial distribution of Δθ.

References

    1. Zankin, A. & Zabothinsky, A. (1970) Nature 255, 535-538.
    1. Winfree, A. T. (1972) Science 175, 634-636. - PubMed
    1. Davidenko, J. M., Pertsov, A. V., Salomonsz, R., Baxter, W. & Jalife, J. (1992) Nature 355, 349-351. - PubMed
    1. Palsson, E. & Cox, E. C. (1996) Proc. Natl. Acad. Sci. USA 93, 1151-1155. - PMC - PubMed
    1. Levine, H., Aranson, I., Tsimring, L. & Truong, T. V. (1996) Proc. Natl. Acad. Sci. USA 93, 6382-6386. - PMC - PubMed

Publication types