. 2005 Mar 29;102(13):4783-8.
doi: 10.1073/pnas.0501283102. Epub 2005 Mar 16.

Low O2 tensions and the prevention of differentiation of hES cells

Affiliations

Low O2 tensions and the prevention of differentiation of hES cells

Toshihiko Ezashi et al. Proc Natl Acad Sci U S A. .

Abstract

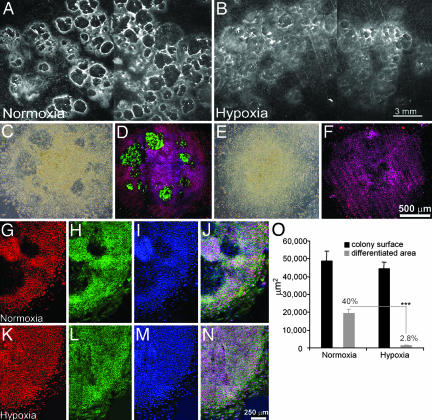
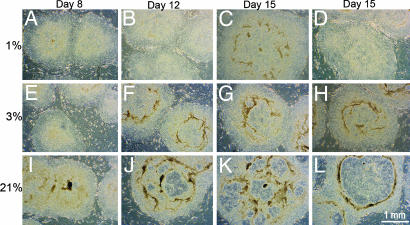
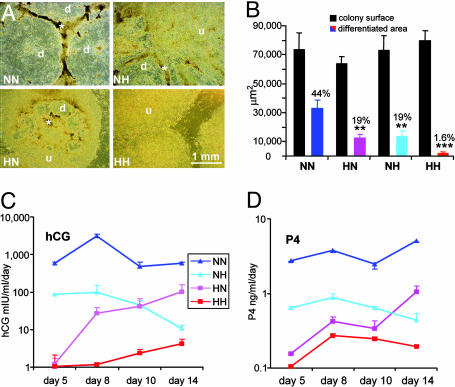
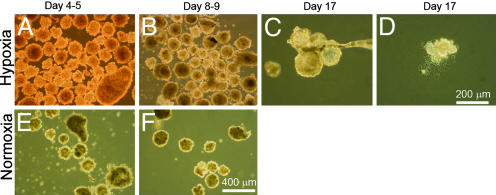
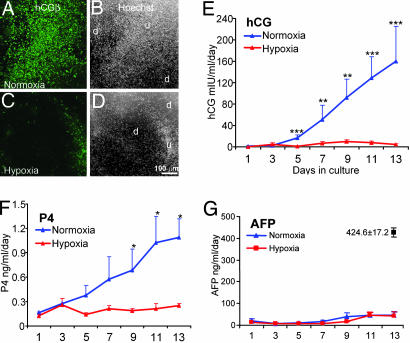
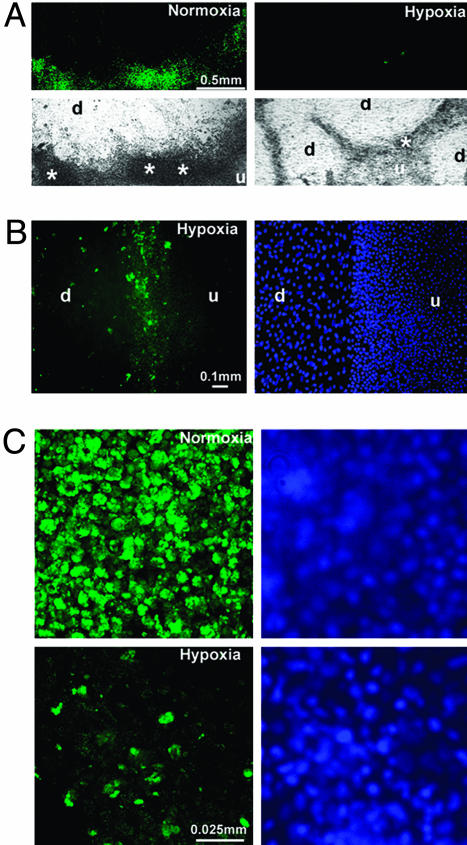
Early-stage mammalian embryos develop in a low O(2) environment (hypoxia). hES cells, however, are generally cultured under an atmosphere of 21% O(2) (normoxia), under which conditions they tend to differentiate spontaneously. Such conditions may not be the most suitable, therefore, for hES cell propagation. Here we have tested two hypotheses. The first hypothesis was that hES cells would grow as well under hypoxic as under normoxic conditions. The second hypothesis was that hypoxic culture would reduce the amount of spontaneous cell differentiation that occurs in hES colonies. Both hypotheses proved to be correct. Cells proliferated as well under 3% and 5% O(2) as they did under 21% O(2), and growth was only slightly reduced at 1% O(2). The appearance of differentiated regions as assessed morphologically, biochemically (by the production of human chorionic gonadotropin and progesterone), and immunohistochemically (by the loss of stage-specific embryonic antigen-4 and Oct-4 and gain of stage-specific embryonic antigen-1 marker expression) was markedly reduced under hypoxic conditions. In addition, hES cell growth under hypoxia provided enhanced formation of embryoid bodies. Hypoxic culture would appear to be necessary to maintain full pluripotency of hES cells.


Figures

Fig. 1.
Fig. 1.
Differentiation of H1 cell colonies cultured under normoxic or hypoxic conditions. (A and B) H1 cells (passage 30) were cultured on MEF feeder cells under normoxic (A) or hypoxic (5% O2)(B) conditions for 12 days and photographed under a stereomicroscope. Differentiated areas appear dark and are surrounded by bright rings. (Bar, 3 mm.) (C-F) H1 cell colonies (passage 36) grown on Matrigel-coated, feeder-free coverslips are shown after culture under normoxic (21% O2)(C and D) or hypoxic conditions (4% O2)(E and F). (C and E) Phase contrast images. Under phase contrast, differentiated areas containing the larger, flatter cells appear darker than the areas occupied by undifferentiated ES cells. (D and F) The colonies have been immunostained for SSEA-1 (green) and Oct-4 (red). Nuclei are colored blue. SSEA-1-positive cells are confined to areas of differentiation, which are not evident in the cells grown under hypoxia. Note the lack of overlap of SSEA-1 and Oct-4 staining. (Bar, 500 μm.) (G-I) Cells cultured as above under normoxia were immunostained for Oct-4 (red) (G), SSEA-4 (green) (H), and TO-PRO-3 (blue) (I) to stain nuclei. (J) The colocalization of Oct-4 and SSEA-4 staining and the absence of both antigens in the differentiated areas. (K-N) Colonies grown under hypoxia and stained as in G-J. (Bar, 250 μm.) (O) Morphometric analysis of differentiated areas within H1 colonies (passage 30) after growth for 12 days under either normoxic or hypoxic (5% O2) conditions. Data for each condition were obtained from the analysis of 15 colonies randomly sampled from three independent culture wells. The graph compares total colony area (black bars) with the overt differentiation area (gray bars). ***, P < 0.0001.
Fig. 2.
Fig. 2.
Morphologies of H1 cell colonies cultured under either normoxic or increasingly hypoxic conditions. The H1 cells (passage 36) were cultured under 1%, 3%, or 21% O2, respectively, for 15 days, and representative colonies were photographed at days 8, 12, and 15 with a 4× objective under darkfield illumination. Differentiated areas appear darker than the more uniform, surrounding regions of undifferentiated ES cells. (Bars, 1 mm.)
Fig. 5.
Fig. 5.
The effects of switching gaseous atmosphere on the morphology and hormone production of hES colonies maintained under normoxic or hypoxic conditions before passage. H1 cells (p31) that were cultured under normoxic or hypoxic conditions for 13 days were subcultured 1:2. (A) The general morphologies of the colonies are presented. d, differentiated areas within colonies; u, undifferentiated areas; *, areas in the transition zones where cells appear to be forming multilayers. (Bar, 1 mm.) (B) Relative areas of overt differentiation were calculated relative to total colony area. Values in columns are means ± SEM for 12-14 colonies from two separate wells per treatment. Black bars show total colony size. Colored bars (NN, blue; HN, pink; NH, azure; HH, red) reflect differentiated areas. (C and D) Daily amounts of hCGβ and P4 produced by the cells.
Fig. 6.
Fig. 6.
EB formation after culture under normoxic or hypoxic conditions. EB bodies were produced from cells (passage 40; ≈2 × 10⁶ cells per well) that had been continuously passaged under hypoxic (Upper) or normoxic (Lower) conditions for ≈4 months. (A and E) EB on days 4 and 5. (B and F) EB on days 8 and 9. (Bar, 0.4 mm.) (C and D) Cystic bodies (C) and attached EB cell explants (D) derived from cells that had been maintained under hypoxic conditions at day 17. (Bar, 0.2 mm.)
Fig. 3.
Fig. 3.
Differentiation of hES cell colonies as determined by immunohistochemical and biochemical analysis. (A-D) Detection of hCGβ by immunofluorescence (green) (A and C) and of nuclei by Hoechst 33258 (white) (B and D) in the H1 cells cultured under normoxic (A and B) or hypoxic (C and D) conditions for 12 days. The photographs encompass areas of overt differentiation (d), which have fewer nuclei and, hence, show less fluorescence with Hoechst dye than the areas appearing undifferentiated (u). CGβ signals (green) (A and C) are largely confined to cells in the “transition zone” between the overtly differentiated areas and the more uniform, undifferentiated areas. (Bar, 100 μm.) (E) The mean daily production of hCG by H1 cells from five independent experiments carried out at passages 30, 31, 32, 36, and 50 under normoxic or hypoxic culture. Values are means ± SEM for 15 independent determinations (n = 3 for each experiment). Values that differ significantly are shown with asterisks (***, P < 0.001; **, P < 0.01; *, P < 0.05). (F) The mean daily production of P4 from four wells in two independent experiments (passages 30 and 31). Values that differ significantly (P < 0.05) are shown with an asterisk. (G) The mean daily production of AFP from the same five independent experiments described in E. No significant differences were observed between normoxic and hypoxic conditions on any of the days of culture, and the production levels were much lower than those observed in H9 cells (1) as indicated (▪).
Fig. 4.
Fig. 4.
Colony morphology and hCG expression after culture of H1 cells under either normoxic or hypoxic conditions for 12 days. (A) Immunofluorescent localization of hCGβ (green) (Upper) and brightfield images (Lower) of the H1 cell colonies (passage 50) cultured under normoxic (Left) or hypoxic (Right) conditions for 12 days. d, differentiated area; u, undifferentiated area; *, transition zone where cells pile up and express hCGβ. (Bar, 0.5 mm.) (B) Immunolocalization of hCGβ (green) (Left) and corresponding Hoechst nuclear staining (Right) in a colony cultured under hypoxic conditions for 12 days. (Bar, 100 μm.) (C) Immunofluorescent detection of hCGβ (green) (Left) and nuclear staining by Hoechst 33258 (blue) (Right) in the H1 cell colonies (passage 50) cultured under normoxic (Upper) and hypoxic (Lower) conditions for 12 days. (Bar, 25 μm.)

References

    1. Thomson, J. A., Itskovitz-Eldor, J., Shapiro, S. S., Waknitz, M. A., Swiergiel, J. J., Marshall, V. S. & Jones, J. M. (1998) Science 282, 1145-1147. - PubMed
    1. Thomson, J. A. & Marshall, V. S. (1998) Curr. Top. Dev. Biol. 38, 133-165. - PubMed
    1. Reubinoff, B. E., Pera, M. F., Fong, C. Y., Trounson, A. & Bongso, A. (2000) Nat. Biotechnol. 18, 399-404. - PubMed
    1. Williams, R., Hilton, D., Pease, S., Willson, T., Stewart, C., Gearing, D., Wagner, E., Metcalf, D., Nicola, N. & Gough, N. (1988) Nature 336, 684-687. - PubMed
    1. Niwa, H. (2001) Cell Struct. Funct. 26, 137-148. - PubMed

Publication types