. 2005 May;12(9):751-61.
doi: 10.1038/sj.gt.3302479.

siRNA targeting the leader sequence of SARS-CoV inhibits virus replication

Affiliations

siRNA targeting the leader sequence of SARS-CoV inhibits virus replication

T Li et al. Gene Ther. 2005 May.

Abstract

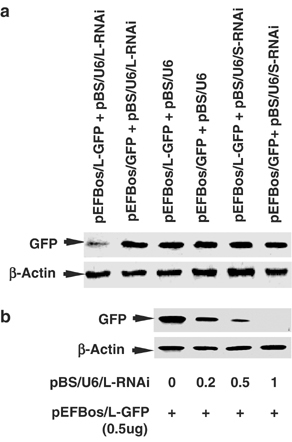
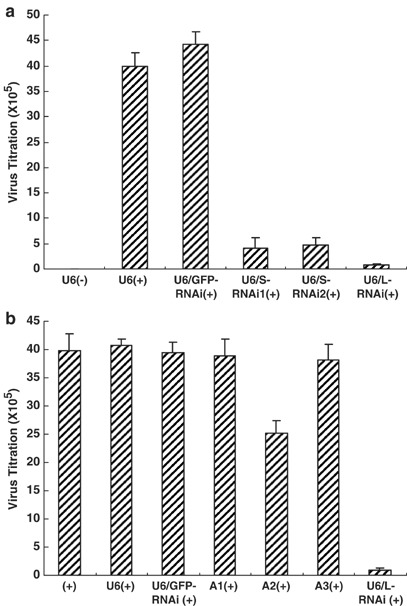
SARS-CoV (the SARS-Associated Coronavirus) was reported as a novel virus member in the coronavirus family, which was the cause of severe acute respiratory syndrome. Coronavirus replication occurs through a unique mechanism employing Leader sequence in the transcripts when initiating transcription from the genome. Therefore, we cloned the Leader sequence from SARS-CoV(BJ01), which is identical to that identified from SARS-CoV(HKU-39849), and constructed specific siRNA targeting the Leader sequence. Using EGFP and RFP reporter genes fused with the cloned SARS-CoV Leader sequence, we demonstrated that the siRNA targeting the Leader sequence decreased the mRNA abundance and protein expression levels of the reporter genes in 293T cells. By stably expressing the siRNA in Vero E6 cells, we provided data that the siRNA could effectively and specifically decrease the mRNA abundance of SARS-CoV genes as analyzed by RT-PCR and Northern blot. Our data indicated that the siRNA targeting the Leader sequence inhibited the replication of SARS-CoV in Vero E6 cells by silencing gene expression. We further demonstrated, via transient transfection experiments, that the siRNA targeting the Leader sequence had a much stronger inhibitory effect on SARS-CoV replication than the siRNAs targeting the Spike gene or the antisense oligodeoxynucleotides did. This report provides evidence that targeting Leader sequence using siRNA could be a powerful tool in inhibiting SARS-CoV replication.


Figures

Figure 1
Figure 1
Sequence information for SARS-CoV used for siRNA design. (a) Leader sequence information from different transcripts of the SARS-CoV. The transcripts of SARS-CoV from the infected Vero E6 cells were 5′-RACE and RT-PCR amplified and sequenced. The identical Leader sequences were boxed. The start codons (ATG) for different genes are underlined with italic letters. The targeted sequence in the Leader sequence of SARS-CoV is underlined. The one-step RT-PCR reaction condition was 35 cycles of denaturation (94°C, 30 s), annealing (51°C, 45 s) and extension (72°C: S gene, 1 min; E gene, 25 s; M gene, 45 s; N gene, 1 min 20 s). (b) Schematic of vector for generating siRNA. pBS/U6 promoter, sequence generating siRNA hairpin and transcriptional terminal signal are shown as indicated. (c) Diagram of predicted structure of siRNA from pBS/U6/L-RNAi. UUCAAGAGA was used to generate the hairpin loop, indicated as a cycle.
Figure 2
Figure 2
Artificial reporter vectors with and without a Leader sequence. (a) Diagram for the vector design. Leader sequence (labeled as Leader-S in the box) from SARS-CoV was synthesized and inserted upstream of a GFP or RFP reporter gene driven by an EF-1α or CMV promoter as indicated. a–e are primers described in Materials and methods. (b) RT-PCR results showing the mRNAs from the reporter vectors. 293T cells were transfected with pEFBos/L-GFP (lanes 1 and 5), pEFBos/GFP (lanes 2 and 6), pDsRed1.1/RFP (lanes 3 and 7), pDsRed1.1/L-RFP (lanes 4 and 8). The total RNA was isolated for performance of RT-PCR using the primers as indicated. The predicted bands are listed above the gel. The upper bands (noted as Leader-S+Reporter) are the mRNA from reporter constructs with the Leader sequence of SARS-CoV and the lower bands (noted as Reporter) are from reporter constructs without the Leader sequence. DNA ladder is shown on the left of the gel. The PCR reaction condition was 25 cycles of denaturation (94°C, 30 s), annealing (50°C, 1 min) and extension (72°C, 1 min).
Figure 4
Figure 4
Fluorescence microscopy observation of reporter gene expression in transfected cells. 293T cells were cotransfected with the reporter constructs and the pBS/U6/L-RNAi (A) or pBS/U6/S-RNAi (B) vector. The reporter constructs used are a, b and c, and j, k and l: pEFBos/GFP and pDsRed1.1/RFP; d, e and f, and m, n and o: PEFBos/L-GFP and pDsRed1.1/RFP; g, h and i, and p, q and r: pDsRed1.1/L-RFP and PEFBos/GFP. The same field was observed by red color (excitation, 510–560 nm; emission, 590 nm) and green color (excitation, 450–490 nm; emission, 520 nm) and the two color pictures were merged in the right panel. Note that pBS/U6/L-RNAi significantly inhibited reporter gene expression (e and g).
Figure 3
Figure 3
Inhibition of reporter gene expression by siRNA. The reporter constructs as indicated were cotransfected with the pBS/U6/L-RNAi (lanes 1–4) or pBS/U6/S-RNAi (lanes 5–8) into 293T cells. Total RNA was isolated for performance of RT-PCR using the primers as indicated. The comparison of the effect of siRNA should be between lanes 1 and 5, 2 and 6, 3 and 7, and 4 and 8. β-actin was used as an internal control. The PCR reaction conditions were 25 cycles of denaturation (94°C, 30 s), annealing (50°C, 1 min) and extension (72°C, 1 min).
Figure 5
Figure 5
Western blot analysis of GFP protein expression in transfected cells. (a) pEFBos/L-GFP or pEFBos/GFP vector was cotransfected with pBS/U6/L-RNAi, pBS/U6 or pBS/U6/S-RNAi in Vero E6 cells as indicated. The cells were lysed and subjected to Western blot using anti-GFP antibody. β-actin was used as internal control to indicate even transfection efficiency and loading. (b) pEFBos/L-GFP (0.5 μg) were cotransfected with the indicated increasing amounts of pBS/U6/L-RNAi in Vero E6 cells. Western blot was employed to show the expression of GFP protein. Note that the GFP protein decreased dramatically with increasing amounts of pBS/U6/L-RNAi used, while the β-actin level remained stable.
Figure 6
Figure 6
Inhibition of SARS-CoV gene expression by siRNA in Vero E6 cells. (a) Establishment of stable cell lines with the siRNA. Vero E6 cells were transfected with the indicated plasmids. The cells were selected with G418 and the clones were examined by PCR with specific primers described in Materials and methods. The cells were named using the recombinant U6, U6/GFP-RNAi or U6/L-RNAi, respectively. The positive control was from the cells transiently transfected with pBS/U6/L-RNAi. (b) L-RNAi inhibits different gene expression of SARS-CoV in stable cell lines detected by RT-PCR. The PCR reaction condition was cycles (S gene, 30; E gene, 27; M gene, 27; N gene, 25; N-fl, 25) of denaturation (94°C, 30 s), annealing (51°C, 45 s) and extension (72°C: S gene, 1 min; E gene 25 s; M gene 45 s; N gene, 1 min 20 s; N-fl, 1 min 45 s). The indicated stable cell lines in 60 mm dishes were infected with SARS-CoV (BJ01) at 1 × 10⁶ PFU for 2 h and cultured for 24 h. The total RNA of the cell lysates was used for the RT-PCR. β-actin was used as internal control for same PCR cycles and loading. The different gene fragments are labeled as S, E, M, N and N-fl, respectively. Note that the amounts of the PCR products were dramatically decreased in the stable cell line with U6/L-RNAi. (c) Quantitative analysis of PCR products. All the bands were quantitated by ImageQuant5.1 software (Amersham-Pharmacia’s Biotech). The percentages of the band densities were presented.
Figure 7
Figure 7
SARS-CoV gene expression patterns in Vero E6 cells. (a) Northern blot of different genes of SARS-CoV in transfected cells. The total RNA from the indicated cells infected with SARS-CoV was subjected to Northern blot analysis with 32P-labeled probes amplified from SARS-CoV cDNA (BJ01). 28S and 18S ribosome RNAs were used as control for even loading. Lanes 1–4 represent the indicated cells infected with low titers (1 × 10⁶ PFU) of SARS-CoV and lanes 6–9 represent higher titers (2 × 10⁷ PFU) of virus infection. Lane 5 presents the cells without infection. The indicated stable cell lines were infected with SARS-CoV (BJ01) for 2 h and cultured for 24 h. (b) Quantitative presentation of the gene expression patterns of SARS-CoV. Three bands indicated as asterisk in each treatment were quantitated by ImageQuant5.1 software (Amersham-Pharmacia’s Biotech). The band densities were presented as percentages. The three band percentages were averaged. The bars denote the standard error of the mean. The results from low or high titer virus infection were presented separately as indicated.
Figure 8
Figure 8
SARS-CoV infection in Vero E6 cells in the presence of stable expression of siRNAs. (a) Cell staining. The indicated cells in 24-well plates were infected with 1 × 10⁶ PFU of SARS-CoV per well for 2 h and cultured for 72 h. The cells were stained with crystal violet. The staining represents normal cells and no staining represents lysed cells by the SARS-CoV. (+) indicates the cells infected with SARS-CoV. (−) indicates normal cultured cells. Duplicate plates are presented. (b) Cell morphology observation. The indicated cells (same treatment with SARS-CoV as D) were subjected to microscopy for the observation of cell morphology. (+) indicates the cells infected with SARS-CoV. (−) indicates normal cultured cells. (c) SARS-CoV titration in the supernatant medium of the infected cells. The same titers of SARS-CoV were used to infect the cells as indicated at the same conditions in (a and b). The virus titrations were determined for the supernatant medium using 96-well plates. The titrations were presented as PFU. Three independent assays were performed and the results were presented as average plus standard error. (+) indicates cells infected with SARS-CoV, (−) indicates cells without SARS-CoV infection.
Figure 9
Figure 9
SARS-CoV infection in Vero E6 cells transiently transfected with siRNA vectors or oligodeoxynucleotides. The indicated siRNA plasmids and the antisense oligodeoxynucleotides were transiently transfected into Vero E6 cells in 24-well plates via Lipofectamine 2000. The transfected cells were infected with the 1 × 10⁵ PFU of SARS-CoV per well for 2 h and cultured for 48 h. The virus titers in the cells were evaluated and the titrations were presented as PFU. Three independent assays were performed and the results were presented as average plus standard error. (+) indicates cells infected with SARS-CoV, (−) indicates cells without SARS-CoV infection. (a) Comparison of siRNA targeting the Leader sequence and the Spike gene. (b) Comparison of siRNA targeting to the Leader sequence and antisense oligodeoxynucleotides.

Similar articles

Cited by

References

    1. Blackmore T. Severe acute respiratory syndrome: a storm in a teacup? N Z Med J. 2003;116:U397. - PubMed
    1. Parry J. SARS virus identified, but the disease is still spreading. BMJ. 2003;326:897. doi: 10.1136/bmj.326.7395.897. - DOI - PMC - PubMed
    1. Holmes KV. SARS-associated coronavirus. N Engl J Med. 2003;348:1948–1951. doi: 10.1056/NEJMp030078. - DOI - PubMed
    1. Drosten C, et al. Identification of a novel coronavirus in patients with severe acute respiratory syndrome. N Engl J Med. 2003;348:1967–1976. doi: 10.1056/NEJMoa030747. - DOI - PubMed
    1. Ksiazek TG, et al. A novel coronavirus associated with severe acute respiratory syndrome. N Engl J Med. 2003;348:1953–1966. doi: 10.1056/NEJMoa030781. - DOI - PubMed

Publication types

MeSH terms