

Towards precise classification of cancers based on robust gene functional expression profiles
- PMID: 15774002
- PMCID: PMC1274255
- DOI: 10.1186/1471-2105-6-58
Towards precise classification of cancers based on robust gene functional expression profiles
Abstract
Background: Development of robust and efficient methods for analyzing and interpreting high dimension gene expression profiles continues to be a focus in computational biology. The accumulated experiment evidence supports the assumption that genes express and perform their functions in modular fashions in cells. Therefore, there is an open space for development of the timely and relevant computational algorithms that use robust functional expression profiles towards precise classification of complex human diseases at the modular level.
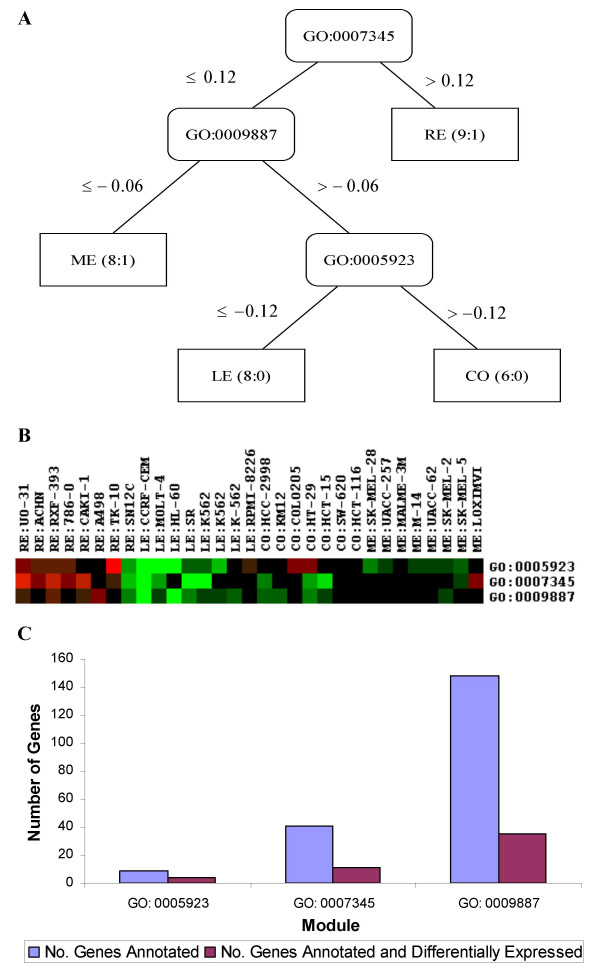
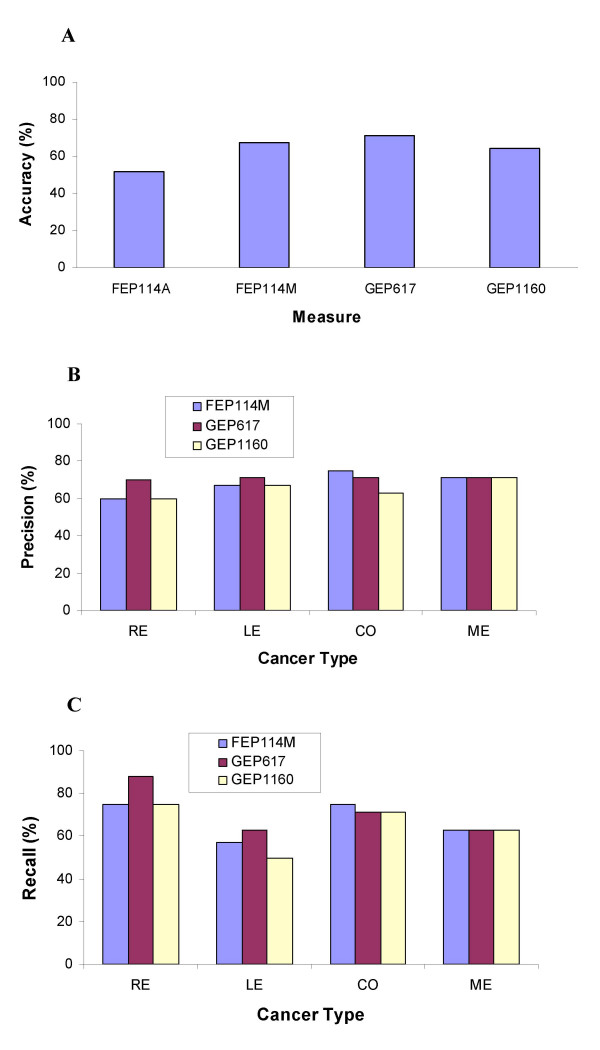
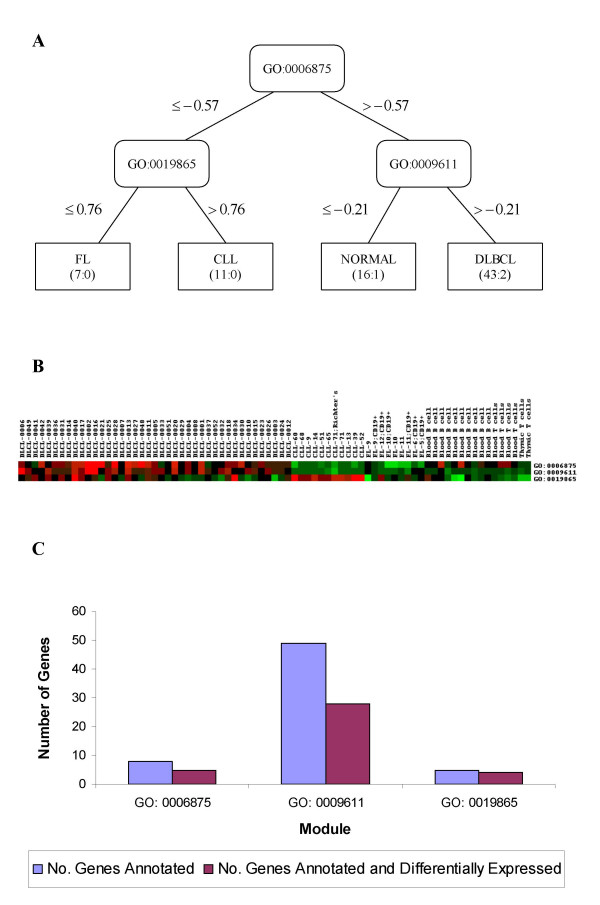
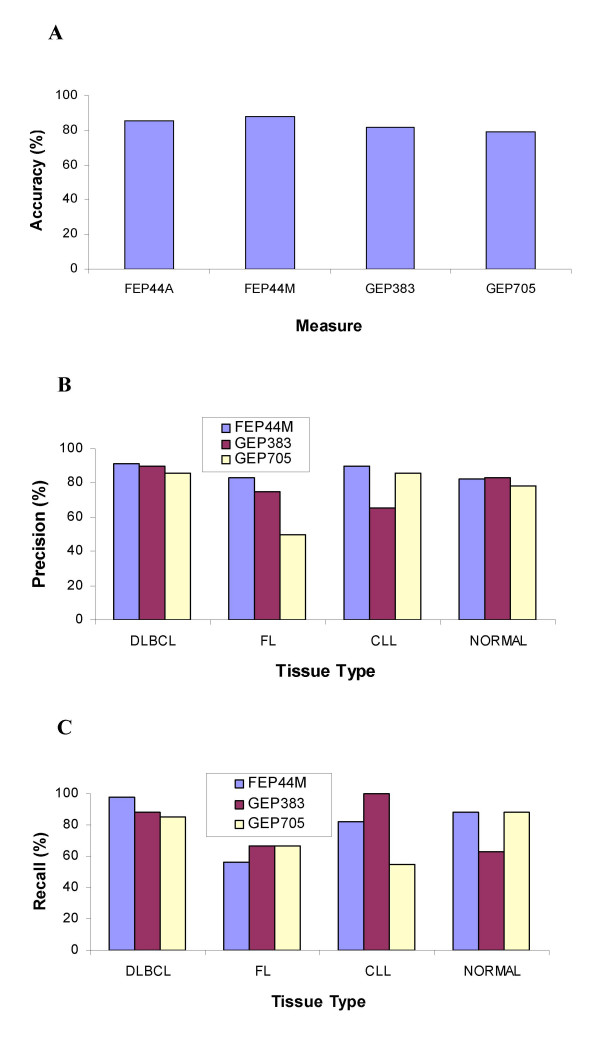
Results: Inspired by the insight that genes act as a module to carry out a highly integrated cellular function, we thus define a low dimension functional expression profile for data reduction. After annotating each individual gene to functional categories defined in a proper gene function classification system such as Gene Ontology applied in this study, we identify those functional categories enriched with differentially expressed genes. For each functional category or functional module, we compute a summary measure (s) for the raw expression values of the annotated genes to capture the overall activity level of the module. In this way, we can treat the gene expressions within a functional module as an integrative data point to replace the multiple values of individual genes. We compare the classification performance of decision trees based on functional expression profiles with the conventional gene expression profiles using four publicly available datasets, which indicates that precise classification of tumour types and improved interpretation can be achieved with the reduced functional expression profiles.
Conclusion: This modular approach is demonstrated to be a powerful alternative approach to analyzing high dimension microarray data and is robust to high measurement noise and intrinsic biological variance inherent in microarray data. Furthermore, efficient integration with current biological knowledge has facilitated the interpretation of the underlying molecular mechanisms for complex human diseases at the modular level.
Figures
Similar articles
-
Quadratic regression analysis for gene discovery and pattern recognition for non-cyclic short time-course microarray experiments.BMC Bioinformatics. 2005 Apr 25;6:106. doi: 10.1186/1471-2105-6-106. BMC Bioinformatics. 2005. PMID: 15850479 Free PMC article.
-
CAGER: classification analysis of gene expression regulation using multiple information sources.BMC Bioinformatics. 2005 May 12;6:114. doi: 10.1186/1471-2105-6-114. BMC Bioinformatics. 2005. PMID: 15890068 Free PMC article.
-
MILANO--custom annotation of microarray results using automatic literature searches.BMC Bioinformatics. 2005 Jan 20;6:12. doi: 10.1186/1471-2105-6-12. BMC Bioinformatics. 2005. PMID: 15661078 Free PMC article.
-
Optimal gene expression analysis by microarrays.Cancer Cell. 2002 Nov;2(5):353-61. doi: 10.1016/s1535-6108(02)00181-2. Cancer Cell. 2002. PMID: 12450790 Review.
-
Microarrays--identifying molecular portraits for prostate tumors with different Gleason patterns.Methods Mol Med. 2008;141:131-51. doi: 10.1007/978-1-60327-148-6_8. Methods Mol Med. 2008. PMID: 18453088 Review.
Cited by
-
Robust pathway-based multi-omics data integration using directed random walks for survival prediction in multiple cancer studies.Biol Direct. 2019 Apr 29;14(1):8. doi: 10.1186/s13062-019-0239-8. Biol Direct. 2019. PMID: 31036036 Free PMC article.
-
Knowledge-driven genomic interactions: an application in ovarian cancer.BioData Min. 2014 Sep 9;7:20. doi: 10.1186/1756-0381-7-20. eCollection 2014. BioData Min. 2014. PMID: 25214892 Free PMC article.
-
An Entropy-Based Directed Random Walk for Cancer Classification Using Gene Expression Data Based on Bi-Random Walk on Two Separated Networks.Genes (Basel). 2023 Feb 24;14(3):574. doi: 10.3390/genes14030574. Genes (Basel). 2023. PMID: 36980844 Free PMC article.
-
Prediction of breast cancer metastasis by gene expression profiles: a comparison of metagenes and single genes.Cancer Inform. 2012;11:193-217. doi: 10.4137/CIN.S10375. Epub 2012 Dec 10. Cancer Inform. 2012. PMID: 23304070 Free PMC article.
-
Pathway-based classification of cancer subtypes.Biol Direct. 2012 Jul 3;7:21. doi: 10.1186/1745-6150-7-21. Biol Direct. 2012. PMID: 22759382 Free PMC article.
References
-
- Ross DT, Scherf U, Eisen MB, Perou CM, Rees C, Spellman P, Iyer V, Jeffrey SS, Van de Rijn M, Waltham M, Pergamenschikov A, Lee JC, Lashkari D, Shalon D, Myers TG, Weinstein JN, Botstein D, Brown PO. Systematic variation in gene expression patterns in human cancer cell lines. Nat Genet. 2000;24:227–235. doi: 10.1038/73432. - DOI - PubMed
-
- Alizadeh AA, Eisen MB, Davis RE, Ma C, Lossos IS, Rosenwald A, Boldrick JC, Sabet H, Tran T, Yu X, Powell JI, Yang L, Marti GE, Moore T, Hudson JJ, Lu L, Lewis DB, Tibshirani R, Sherlock G, Chan WC, Greiner TC, Weisenburger DD, Armitage JO, Warnke R, Levy R, Wilson W, Grever MR, Byrd JC, Botstein D, Brown PO, Staudt LM. Distinct types of diffuse large B-cell lymphoma identified by gene expression profiling. Nature. 2000;403:503–511. doi: 10.1038/35000501. - DOI - PubMed
Publication types
MeSH terms
Grants and funding
LinkOut - more resources
Full Text Sources
