. 2005 Jun 15;565(Pt 3):911-25.
doi: 10.1113/jphysiol.2005.084525. Epub 2005 Mar 17.

Sustained rise in triacylglycerol synthesis and increased epididymal fat mass when rats cease voluntary wheel running

Affiliations

Sustained rise in triacylglycerol synthesis and increased epididymal fat mass when rats cease voluntary wheel running

David S Kump et al. J Physiol. .

Abstract

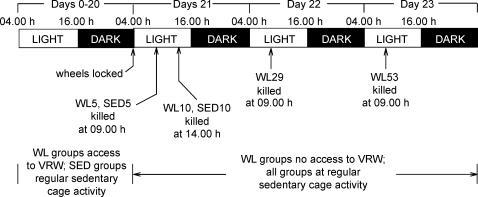
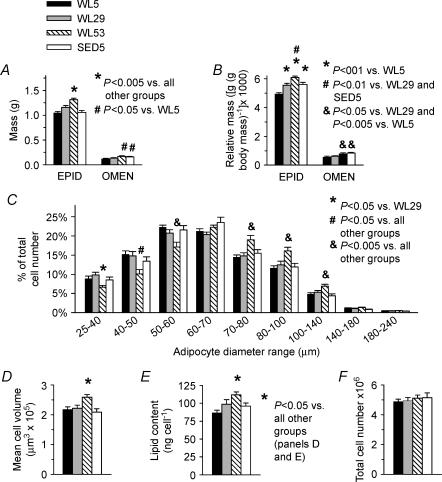
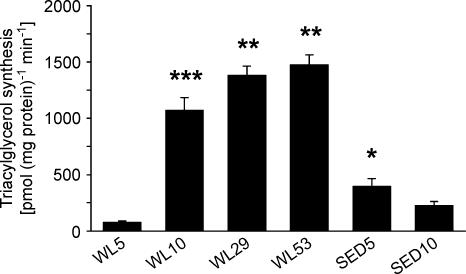
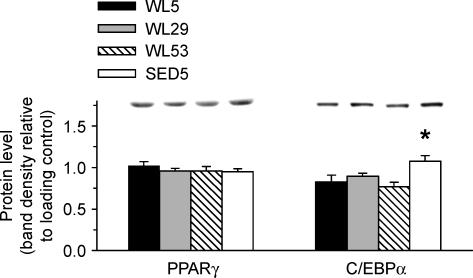
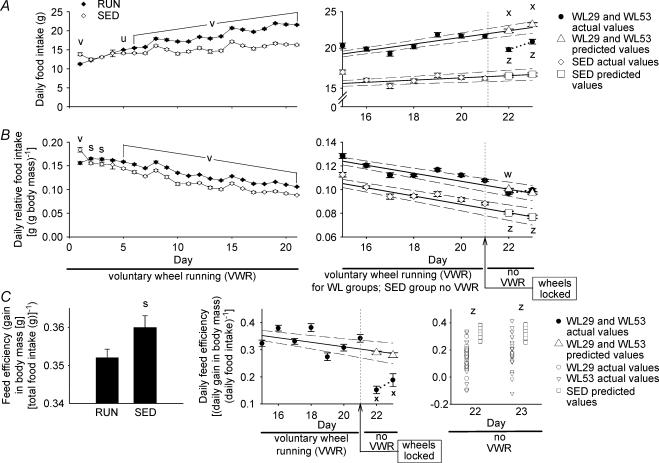
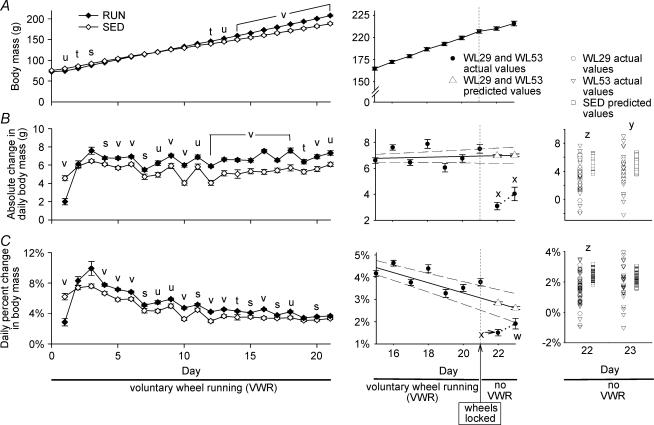
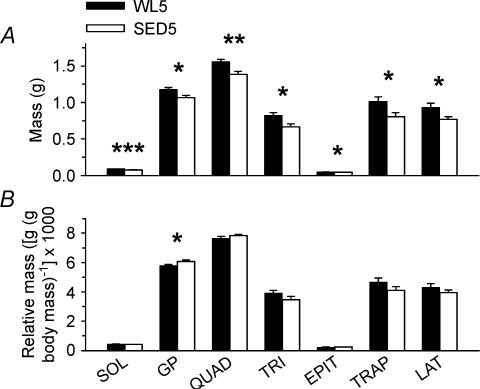
Four-week-old, Fischer-Brown Norway F1-generation male rats were given access to voluntary running wheels for 21 days, and then the wheels were locked for 5 (WL5), 10 (WL10), 29 (WL29), or 53 (WL53) hours. Two other groups (SED5 and SED10) had no access to voluntary running wheels and were killed at the same time as WL5 and WL10, respectively. Absolute and relative epididymal fat mass, mean cell volume, and amount of lipid per cell increased in WL53 relative to all other groups, with no change in cell number. C/EBPalpha protein levels in epididymal fat were 30% greater in SED5 than in WL5. The rate of triacylglycerol synthesis in epididymal fat was 4.2-fold greater in SED5 than in WL5, increased 14-fold between WLS and WL10, and was 79% lower in SED10 than in WL10. Triacylglycerol synthesis remained at this elevated level (at least 3.5-fold greater than SED5) through WL53. Thus, the rapid increase in epididymal fat mass with the cessation of voluntary wheel running is associated with a prolonged overshoot in epididymal fat triacylglycerol synthesis. Moreover, rats without running wheels had a 9.4% lower body mass after 21 days than those with running wheels. The individual mass of seven different muscles from the hindlimb, upper forelimb, and back were each lower in animals without running wheels, suggesting that physical activity in rapidly growing rats may be requisite for optimal muscle development.


Figures

Figure 1
Figure 1. Experimental design
The top two lines represent the time line. The bar represents the light : dark cycle. Preliminary studies showed that > 99% of the running occurred during the dark cycle (data not shown). Wheel lock (WL) groups were given access to voluntary running wheels (VRW) at the start of day 0. Groups with regular sedentary cage activity (SED) were housed without VRW. For WL groups, wheels were locked at 04.00 h on day 21 (bottom lines); arrows pointing to bar indicate the time of kill. Access to food was denied at 04.00 h on the day of kill for a given group. See Methods for more detail.
Figure 2
Figure 2. Running activity
The mean daily running distance (A) and time (B) of the combined running groups are shown. Data points represent the mean ± s.e.m. for each day's running activity. n = 88.
Figure 3
Figure 3. Adipose mass and cellularity
Epididymal (EPID) and omental (OMEN) absolute (A) and relative (B) fat mass; C, relative epididymal adipocyte distribution based on cell diameter; D, mean epididymal adipocyte cell volume; E, epididymal fat cellular lipid content; and F, epididymal fat pad total cell number for both left and right pads. Bars represent the means ± s.e.m. Legends for significance are shown separately with each graph; D and E share a significance legend to the right of E. ANOVA with Student-Neuman-Keuls post hoc test was used for all comparisons. n = 26 for epididymal fat mass, 10 for omental fat, and 13–16 for cellularity measurements.
Figure 4
Figure 4. 2-Deoxyglucose uptake into isolated epididymal adipocytes
2-Deoxyglucose uptake values in the presence of 70 μm cytochalasin B for each animal were subtracted from the other values measured in the absence of cytochalasin B (see Methods). Values within a given insulin concentration were compared using ANOVA with the Student-Neuman Keuls post hoc test. n = 12–16 per group.
Figure 5
Figure 5. Triacylglycerol synthesis in epididiymal fat
The capacity for triacylglycerol synthesis was measured in epididymal fat homogenates and is expressed as pmol of palmitic acid incorporated into triacylglycerol per mg of homogenate protein per minute. Comparisons between WL5, WL29, WL53 and SED5 were performed using ANOVA; comparisons between WL5, WL10, SED5 and SED10 were performed using a 2-way ANOVA (see Methods). The Student-Neuman-Keuls post hoc test was used as follow-up for both comparisons. *P < 0.005 versus WL5. **P < 0.001 versus SED5 and WL5. ***P < 0.001 versus SED10 and WL5. n = 10 in each group.
Figure 6
Figure 6. PPARγ and C/EBPα protein levels in epididymal fat
Protein levels are relative to loading control (see Methods). A representative immunoblot for each protein is located above the graph. *Significantly different from all other groups (P < 0.05, ANOVA with Student-Neuman-Keuls post hoc test). n = 10 in each group.
Figure 7
Figure 7. Food consumption
Absolute food intake (A), relative food intake (B), and feed efficiency (C). Leftmost panels: comparison of combined groups (WL5, WL10, WL29, and WL53) with unrestricted voluntary running wheel access (RUN, ♦) and sedentary groups (SED, ⋄). The group legend for the left panels of A and B is located at the top of A. Feed efficiency in the left panel of C is the gain in body mass from days 0 to 21 relative to the total food intake for the same period. Data points and bars represent the mean ± s.e.m. s, u and v; significant difference (P < 0.05, 0.005, and 0.001, respectively; Student's t test) between SED and RUN. n = 88 for RUN and 36 for SED. Right panels of A and B: food intake before and after running wheels were locked. Voluntary running wheels were locked beginning on day 21 (indicated by the arrow; see Supplemental material) so that the rats could not run. Predicted values for days 22 and 23 for WL29 and WL53 (▵) and for SED (□) were predicted from linear regression equations for each animal based on actual values from days 4 to 21 for WL29 and WL53 (•) and SED (⋄). Only data starting on day 15 are shown for clarity of the figure. The continuous lines represent the regression lines, and the dashed lines represent the 95% confidence intervals. The dotted line connects the observed values for days 22 and 23. Comparison 1 (see Supplemental material): the differences between the predicted and observed values for each animal in WL29 and WL53 on days 22 and 23 were compared using Student's t test. w and x, significant difference (P < 0.005 and P < 0.001, respectively) between predicted and actual values for WL29 and WL53. Comparison 2 (see Supplemental material): the differences between predicted values for SED and the observed WL29 and WL53 values were compared using Student's t test. z, significant difference (P < 0.001) between predicted values for SED and actual values for WL29 and WL53. Data points represent the mean ± s.e.m.n = 52 for both the actual and predicted values for the combined WL29 and WL53 on day 22, n = 26 for WL53 on day 23, and n = 36 for SED for both the actual and predicted values. Middle panel of C: same presentation as for right panels of A and B, except that SED values are not plotted and only Comparison 1 is made. Right panel of C: scatter plots of observed feed efficiency values for WL29 (○ in columns 1 and 3) and WL53 (▿ in columns 1 and 3) and predicted values for SED (□ in columns 2 and 4) during no voluntary wheel running (VWR) on days 22 and 23. Data points represent the individual values for each animal. Comparison 2 (see Supplemental material): values for SED were predicted for each animal using linear regression analysis and were compared to observed values for WL29 and WL53 with the Mann-Whitney rank-sum test. z, significant difference (P < 0.001) between predicted values for SED and actual values for WL29 and WL53. n = 26 each for WL29 and WL53 (total of 52 on day 22) and 36 for SED. For both Comparison 1 and Comparison 2, WL29 and WL53 were combined for analysis of day 22; only WL53 was used for analysis of day 23.
Figure 8
Figure 8. Growth characteristics
A, growth curve; B, absolute growth rate; and C, relative growth rate. Absolute growth rate (B) is daily growth expressed as the absolute change from the previous day's mass. Relative growth rate (C) is the daily growth rate expressed as percentage change relative to the previous day's mass. Left panels: comparison of combined groups with unrestricted voluntary running wheel access (RUN; ♦) and groups with regular sedentary cage activity (SED; ⋄) during 21 days of voluntary wheel running. Data points represent the mean ± s.e.m. s, t, u and v, significant difference (P < 0.05, 0.01, 0.005 and 0.001, respectively, between SED and RUN; Student's t test). n = 88 for RUN and 36 for SED. Middle panels: growth characteristics for 7 days prior and 2 days after running wheels were locked. Voluntary running wheels were locked beginning on day 21 (indicated by arrow; see Supplemental material) so that the rats could no longer run. The legend for data points in the lower portion of A is for the middle panels of A, B and C. Middle panel of A: the continuous line connects actual values of the combined WL29 and WL53 groups for days 15–23. No predicted values are displayed in this panel. Middle panels for B and C: Comparison 1 (see Supplemental material): expected values for days 22 and 23 for WL29 and WL53 were predicted from linear regression equations for each animal based on values from days 4 to 21 (only data starting on day 15 are shown for clarity of the figure). ▵, predicted values on days 22 and 23; •, actual values from days 15 to 23. The continous line represents the regression line, and the dashed lines represent the 95% confidence intervals. The dotted line in the lower right-hand corner connects the observed values for days 22 and 23. The differences between the predicted and observed values for each animal were compared using Student's t test. Data points represent the mean ± s.e.m. w and x, significant difference (P < 0.05 and 0.001, respectively) between observed and predicted values. n = 52 for day 22, and n = 26 for day 23. Right panels: Comparison 2 (see Supplemental material): scatter plots of observed values for WL29 (○ in columns 1 and 3) and WL53 (▿ in columns 1 and 3) and predicted values for SED (□ in columns 2 and 4) for absolute and relative growth rates on days 22 and 23. The legend for data points is located above right panel B. Data points represent the individual values for each animal. Values for SED were predicted for each animal using linear regression analysis and were compared to observed values for WL29 and WL53 using the Mann-Whitney rank-sum test. y and z, significantly different (P < 0.005 and 0.001, respectively). n = 26 each for WL29 and WL53 (total of 52 on day 22) and 36 for SED. For both Comparison 1 and Comparison 2, WL29 and WL53 were combined for analysis of day 22; only WL53 was used for analysis of day 23.
Figure 9
Figure 9. Skeletal muscle mass
Absolute (A) and relative (B) wet masses for the soleus (SOL), gastrocnemius/plantaris complex (GP), quadriceps (QUAD), triceps (TRI), epitrochlearis (EPIT), acromiotrapezius (TRAP), and latissimus dorsi (LAT) muscles. Muscles were removed from the left side only; the values shown demonstrate only the unilateral masses. Bars represent the means ± s.e.m.*, ** and ***, significant difference (P < 0.05, 0.01 and 0.001, respectively; Student's t test) between WL5 and SED5 for a given muscle. n = 20 for SOL; 10 for GP, QUAD, TRI and EPIT; and 7 for TRAP and LAT.

Similar articles

Cited by

References

    1. Applegate EA, Stern JS. Exercise termination effects on food intake, plasma insulin, and adipose lipoprotein lipase activity in the Osborne-Mendel rat. Metabolism. 1987;36:709–714. - PubMed
    1. Askew EW, Huston RL, Dohm GL. Effect of physical training on esterification of glycerol-3-phosphate by homogenates of liver, skeletal muscle, heart, and adipose tissue of rats. Metabolism. 1973;22:473–480. - PubMed
    1. Askew EW, Huston RL, Plopper CG, Hecker AL. Adipose tissue cellularity and lipolysis. Response to exercise and cortisol treatment. J Clin Invest. 1975;56:521–529. - PMC - PubMed
    1. Baron AD, Brechtel G, Wallace P, Edelman SV. Rates and tissue sites of non-insulin- and insulin-mediated glucose uptake in humans. Am J Physiol. 1988;255:E769–E774. - PubMed
    1. Booth FW, Chakravarthy MV, Gordon SE, Spangenburg EE. Waging war on physical inactivity: using modern molecular ammunition against an ancient enemy. J Appl Physiol. 2002;93:3–30. - PubMed

Publication types

LinkOut - more resources