. 2005 Jul 1;106(1):345-52.
doi: 10.1182/blood-2005-01-0204. Epub 2005 Mar 17.

The MLL partial tandem duplication: evidence for recessive gain-of-function in acute myeloid leukemia identifies a novel patient subgroup for molecular-targeted therapy

Affiliations

The MLL partial tandem duplication: evidence for recessive gain-of-function in acute myeloid leukemia identifies a novel patient subgroup for molecular-targeted therapy

Susan P Whitman et al. Blood. .

Abstract

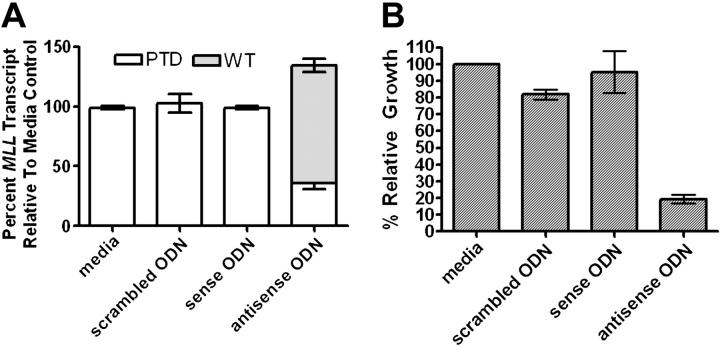
MLL (ALL-1) chimeric fusions and MLL partial tandem duplications (PTD) may have mechanistically distinct contributions to leukemogenesis. Acute myeloid leukemia (AML) blasts with the t(9;11)(p22; q23) express MLL-AF9 and MLL wild-type (WT) transcripts, while normal karyotype AML blasts with the MLL(PTD/WT) genotype express MLL PTD but not the MLL WT. Silencing of MLL WT in MLL(PTD/WT) blasts was reversed by DNA methyltransferase (DNMT) and histone deacetylase (HDAC) inhibitors, and MLL WT induction was associated with selective sensitivity to cell death. Reduction of MLL PTD expression induced MLL WT and reduced blast colony-forming units, supporting opposing functions for MLL PTD and MLL WT whereby the MLL PTD contributes to the leukemic phenotype via a recessive gain-of-function. The coincident suppression of the MLL WT allele with the expression of the MLL PTD allele, along with the functional data presented here, supports the hypothesis that loss of WT MLL function via monoallelic repression contributes to the leukemic phenotype by the remaining mutant allele. These data from primary AML and the pharmacologic reversal of MLL WT silencing associated with a favorable alteration in the threshold for apoptosis suggest that these patients with poor prognosis may benefit from demethylating or histone deacetylase inhibitor therapy, or both.


Figures

Figure 1.
Figure 1.
Schematic demonstrating the QRT-PCR strategy for detection and quantification of the MLL WT and MLL PTD transcripts in normal karyotype AML and in trisomy 11 AML. The predicted MLL PTD and WT allele-derived transcripts are shown, with the tandemly duplicated exons present in the PTD transcript denoted with gray boxes. Shown above the transcripts are sites for PCR primers (arrows) and fluorogenic probes (rectangles) designed to amplify either the exon 11 to 12 (□), exon 13 to 14 (formula image
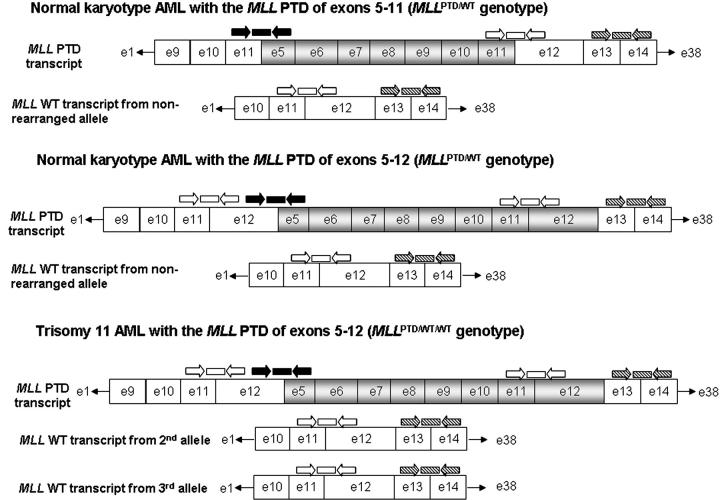
), or exon 26 to 27 (not shown) junctions that are common to the MLL WT and MLL PTD transcripts. Primers and probes (▪) were used to detect the MLL PTD-specific exon 11 to 5 fusion or the exon 12 to 5 fusion found in AML cases with either the MLL PTD of exons 5 through 11 or exons 5 through 12, respectively.
Figure 2.
Figure 2.
The p300-kDa N-terminal MLL WT protein fragment is absent in an MLL PTD+ primary AML blast sample. Immunoblot analysis was performed as described in “Materials and methods.” Lane 1, Mgc80-3 gastric carcinoma cell line with the MLL PTD gene rearrangement; lane 2, primary AML (UPN 300) with the MLLPTD/WT genotype; lane 3, primary AML (UPN 003) with MLLWT/WT genotype; and lane 4, K562 erythroleukemia cell line with the MLLWT/WT genotype. Arrows indicate the p300-kDa MLL WT posttranslational cleavage N-terminal fragment and the predicted approximate 420-kDa MLL PTD N-terminal cleavage products. Additional bands between p300 and p420 in the MLL PTD+ samples may be alternative splicing products or degradation products. Note that, to gain the signals in lane 2, the blot was exposed for a longer period.
Figure 3.
Figure 3.
MLL WT expression is induced in primary MLLPTD/WT blasts treated with 5′-Aza-CdR and depsipeptide. Primary blasts were incubated with media alone or with 5′-Aza-CdR and depsipeptide, singly or in combination, as described in “Materials and methods.” RNA was extracted from viable cells and cDNA was prepared for QRT-PCR assays. MLL PTD and MLL WT transcript levels were determined, and the results are presented as fold increase in MLL WT/MLL PTD transcript ratio relative to the media control sample for each patient AML sample. No MLL WT/MLL PTD ratio is depicted in the graph for media-only controls since no MLL WT was detected under this condition. For those samples in which a treatment condition did not induce MLL WT, the ratio is set to zero, although MLL PTD transcript is present, and these results are represented by dots on the x-axis. Horizontal bars represent mean values.
Figure 4.
Figure 4.
MLL 5′-CpG island methylation status. Genomic DNA was extracted from bone marrow cells enriched for CD34+ cells from 2 disease-free donors and peripheral blood mononuclear cells from 1 disease-free donor. DNA was extracted from diagnostic bone marrow (BM) cells obtained from 2 AML cases with the MLLPTD/WT and 1 AML case with the MLLWT//WT and all with greater than 50% blasts prior to enrichment. BS-PCR sequencing was performed as described in “Materials and methods.” The CpG sites (indicated by vertical lines on a horizontal line representing DNA sequence) evaluated are numbered relative to the known transcriptional initiation site of MLL (arrow above horizontal line). The total number of plasmid subclones sequenced for each sample was 10. Percentage of methylation status (number of times methylation was observed for a particular CpG site of 10 sequenced clones × 100%) is indicated by shading of circles.
Figure 5.
Figure 5.
HDAC inhibition induces binding of acetylated histones H3 and H4 to the MLL transcriptional initiation site in primary MLLPTD/WT leukemic blasts. (A) Primary MLLPTD/WT AML blasts (UPN 300) and (B) primary MLLWT/WT AML blasts (UPN 003) were cultured in media alone or in media containing 20 nM depsipeptide. An aliquot of cells was removed from each flask after 6 hours, and ChIP was performed with the indicated antibodies. PCR reactions with immunoprecipitated protein-DNA complexes were carried out using MLL- and GAPDH-specific primer pairs, and amplification products were detected in ethidium bromide–stained agarose gels for qualitative assessment. (C) Real-time PCR-based quantification of the ChIP with SybrGreen dye. Results are expressed as the percentage of change in modified histone levels at the MLL transcription initiation site in the depsipeptide-treated sample relative to media controls set to 100%.
Figure 6.
Figure 6.
Selective sensitivity of primary MLLPTD/WT AML cells to enhanced cell death with 5′-Aza-CdR and depsipeptide treatment. Primary patient samples with either the MLLPTD/WT or the MLLWT/WT genotype were incubated with media alone or treated singly or with the sequential combination of 5′-Aza-CdR followed by depsipeptide as described in “Materials and methods.” At the end of the incubation period, viable cell number was determined by trypan blue dye exclusion. The data are presented as percentage of cell death in the combination-treated cells relative to the media control cells. The P value was determined with the Mann-Whitney U test. Horizontal bars represent mean values.
Figure 7.
Figure 7.
Down-regulation of MLL PTD fusion transcript is associated with induction of MLL WT and reduced AML-CFUs. (A) Antisense inhibition of expression of the MLL PTD with the exon 12 to exon 5 self-fusion in primary MLLPTD/WT AML blasts. Cells were treated as described in “Materials and methods” and using 10 μg/mL phosphothiorated ODNs. QRT-PCR was performed in duplicate to determine the MLL WT/MLL PTD transcript ratio after treatment in vitro with media only or ODNs. Data are presented as the percentage of total MLL transcript present in the sample. (B) Inhibition of AML blast-colony-forming unit (CFU) formation using antisense ODNs (10 μg/mL) directed against the MLL PTD of exons 5 through 12. Cells were treated as described in “Materials and methods” and plated in media-supplemented methylcellulose for colony formation. The number of colonies arising in the media-only controls represents maximal growth (100%). Results are presented as the percentage of growth relative to media-only control growth ± SD and are representative of 3 separate experiments.

References

    1. Ernst P, Wang J, Korsmeyer SJ. The role of MLL in hematopoiesis and leukemia. Curr Opin Hematol. 2002;9: 282-287. - PubMed
    1. Caligiuri MA, Schichman SA, Strout MP, et al. Molecular rearrangement of the ALL-1 gene in acute myeloid leukemia without cytogenetic evidence of 11q23 chromosomal translocations. Cancer Res. 1994;54: 370-373. - PubMed
    1. Schichman SA, Caligiuri MA, Gu Y, et al. ALL-1 partial duplication in acute leukemia. Proc Natl Acad Sci U S A. 1994;91: 6236-6239. - PMC - PubMed
    1. Baffa R, Negrini M, Schichman SA, Huebner K, Croce CM. Involvement of the ALL-1 gene in a solid tumor. Proc Natl Acad Sci U S A. 1995;92: 4922-4926. - PMC - PubMed
    1. Megonigal M, Rappaport E, Jones D, Kim C, Nowell P, Felix C. Panhandle PCR strategy to amplify MLL genomic breakpoints in treatment-related leukemias. Proc Natl Acad Sci U S A. 1997;94: 11583-11588. - PMC - PubMed

Publication types

MeSH terms