Comparative Study
. 2005 May 2;485(2):108-26.
doi: 10.1002/cne.20487.

Ultrastructural analysis of projections to the pulvinar nucleus of the cat. II: Pretectum

Affiliations
Comparative Study

Ultrastructural analysis of projections to the pulvinar nucleus of the cat. II: Pretectum

Zsolt B Baldauf et al. J Comp Neurol. .

Abstract

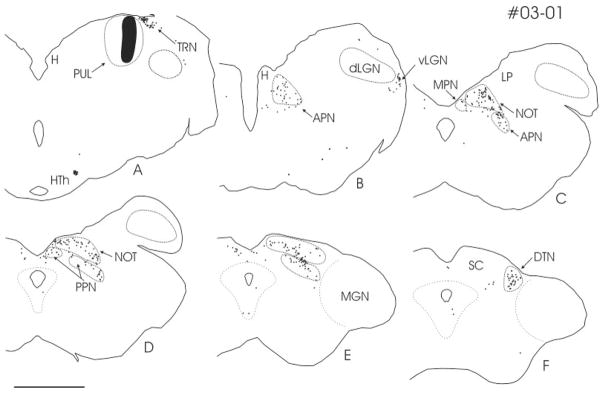
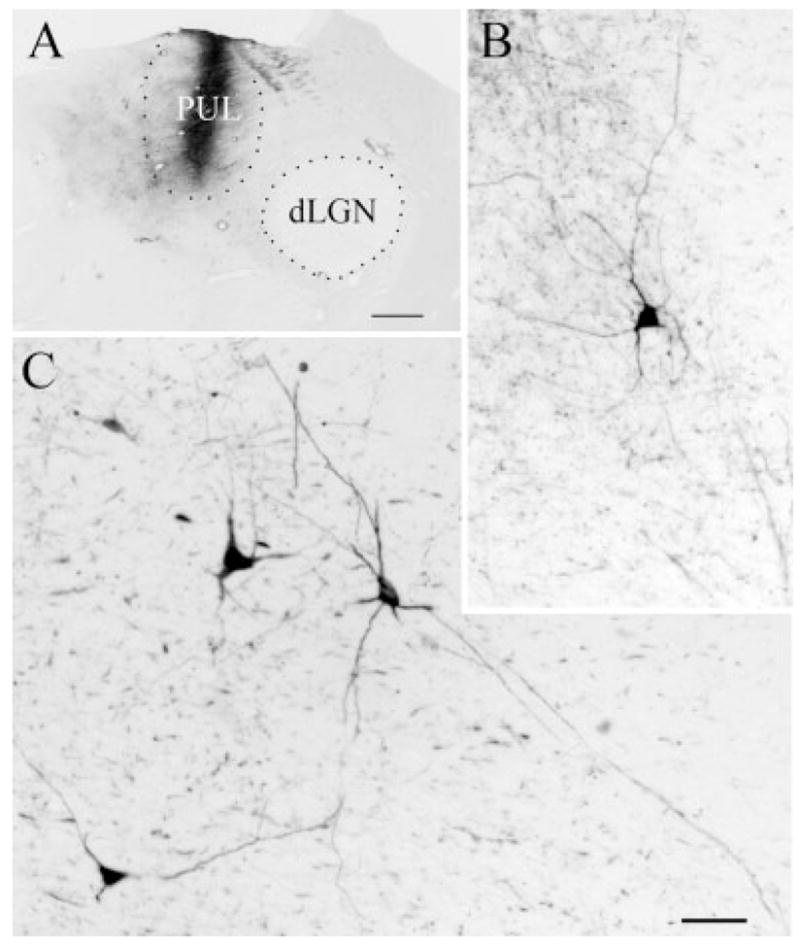
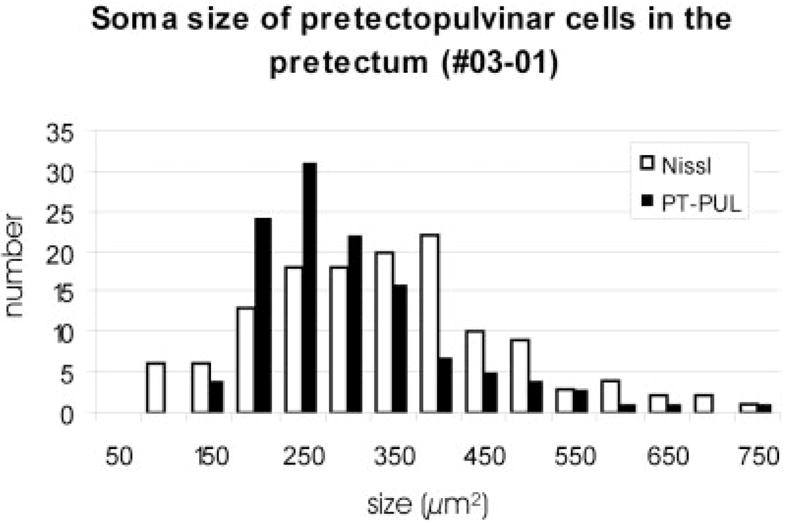
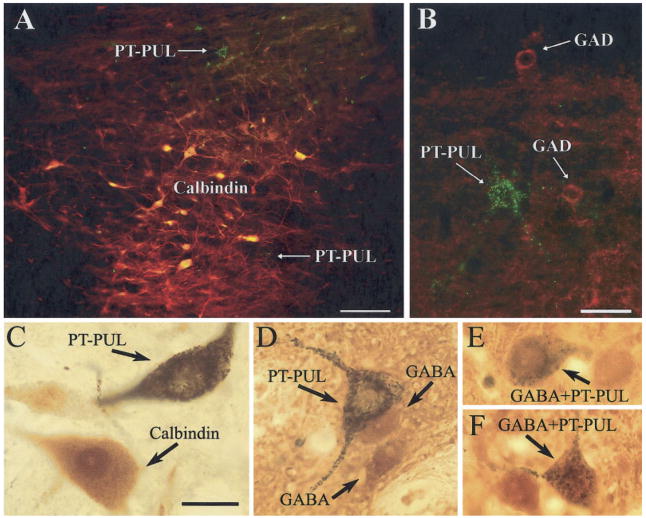
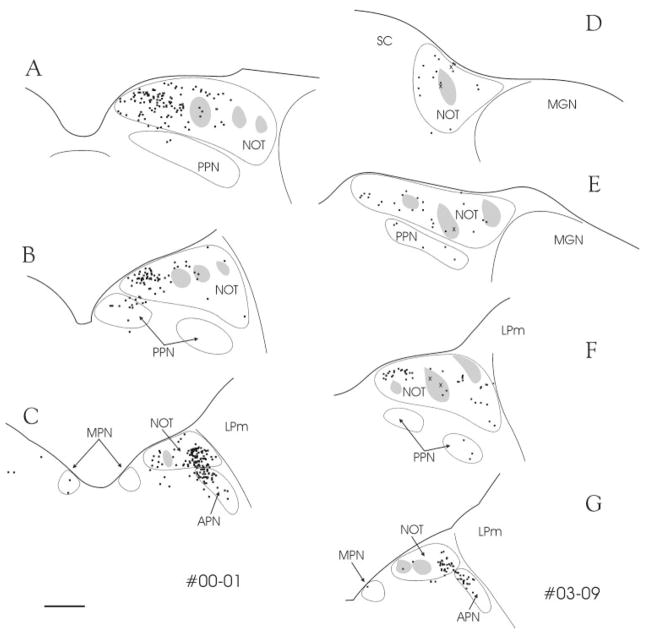
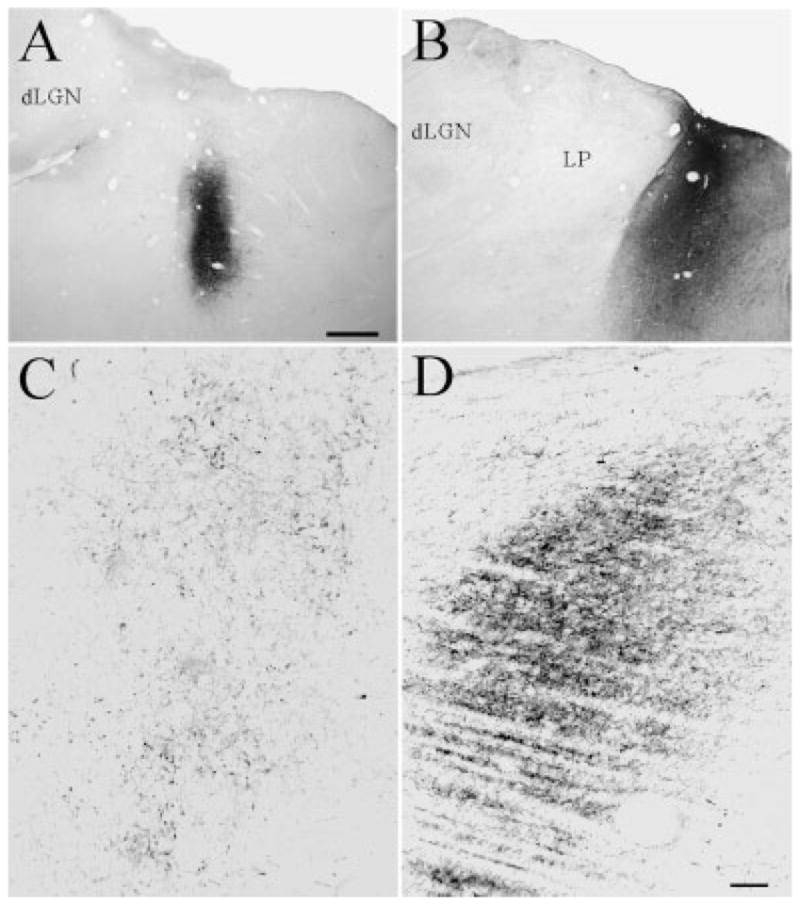
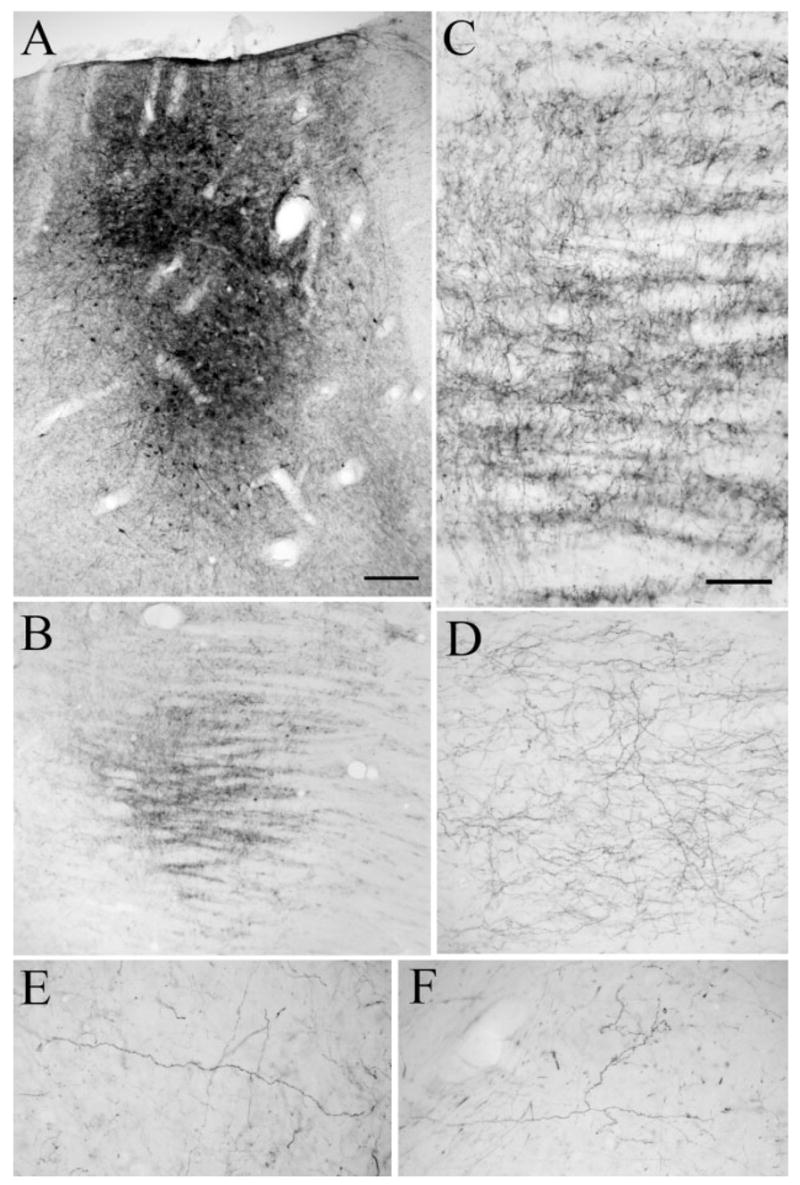
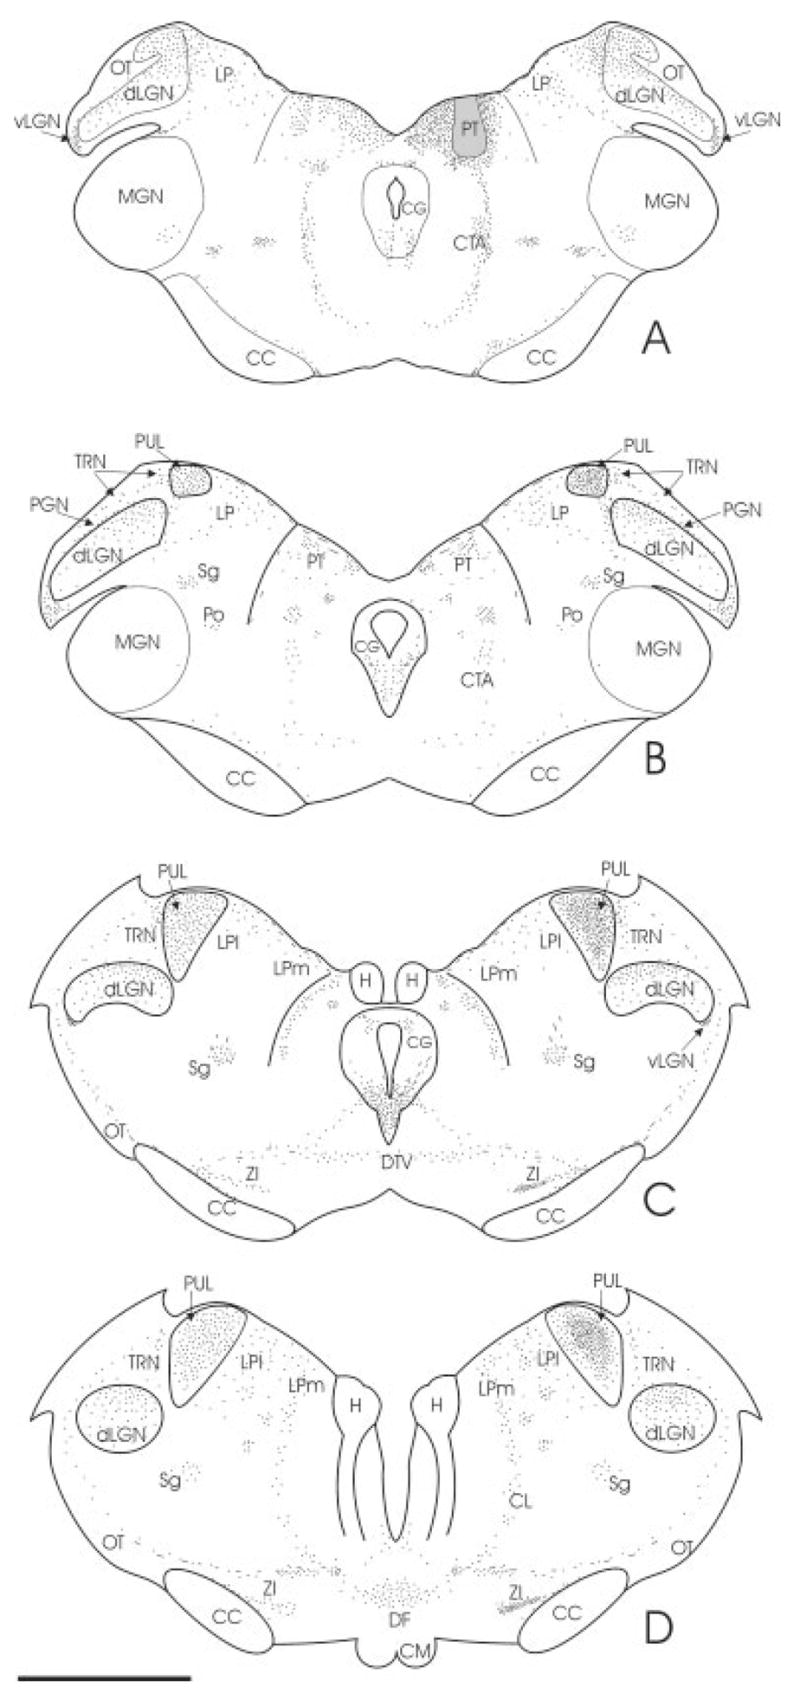
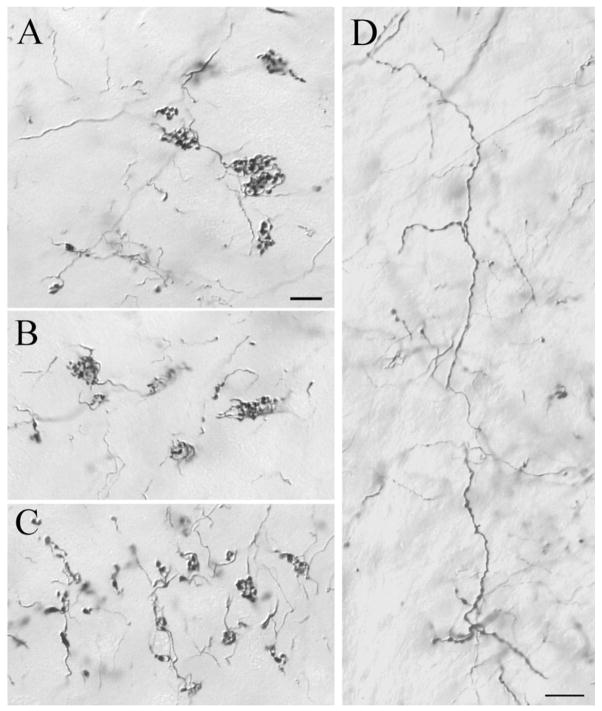
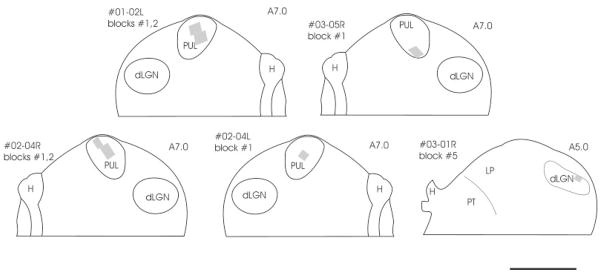
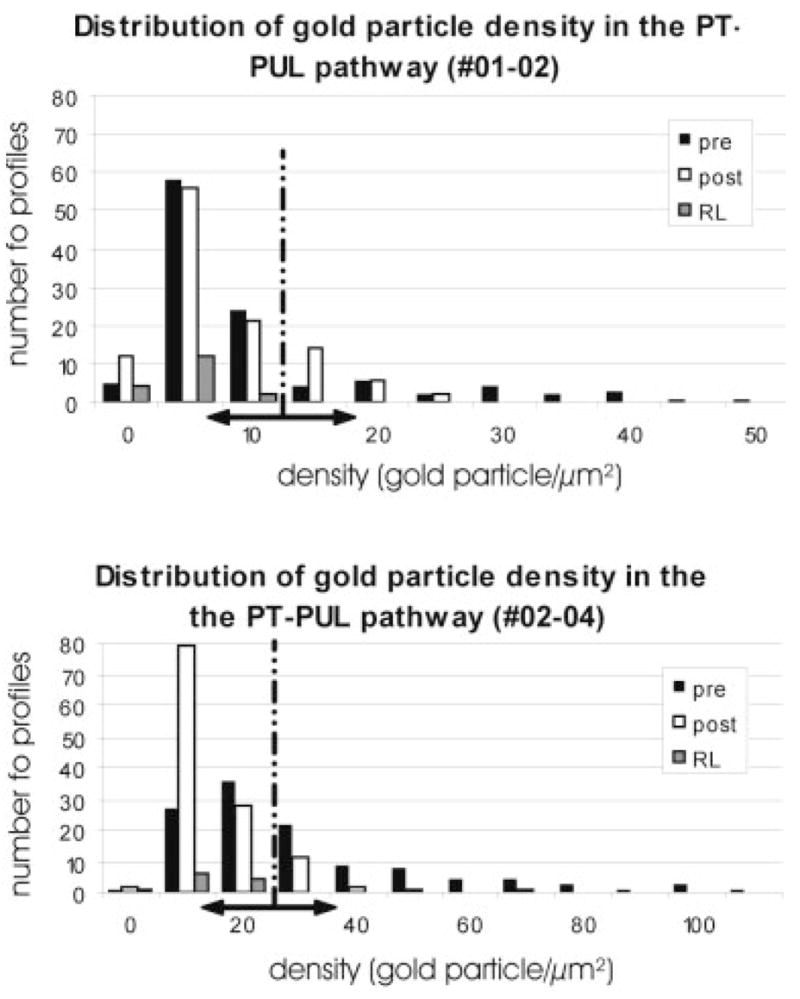
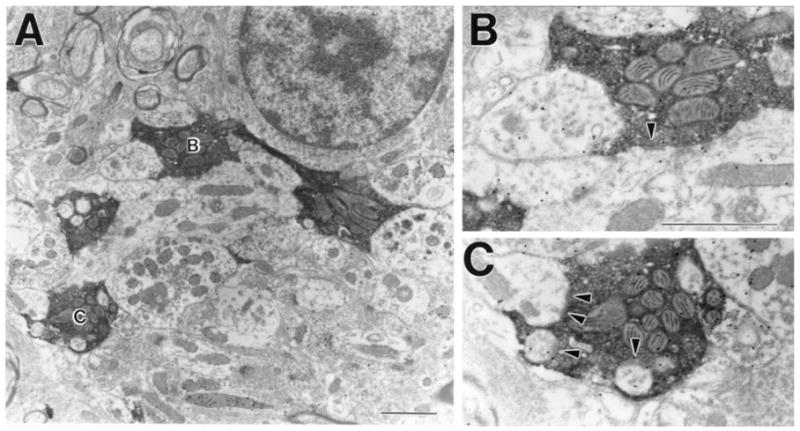
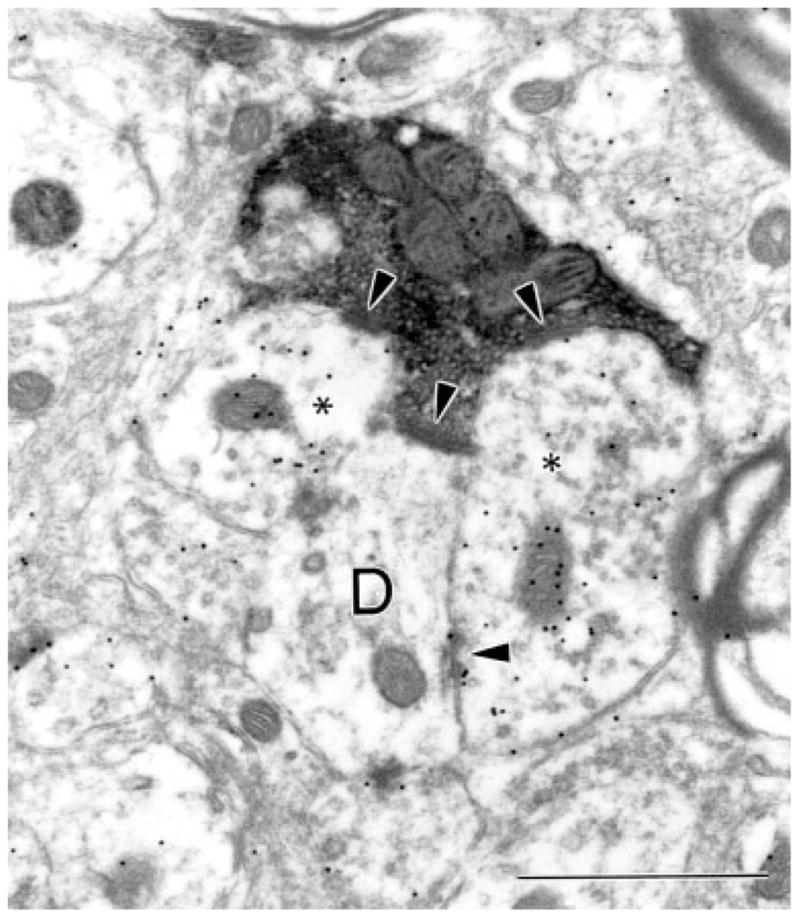
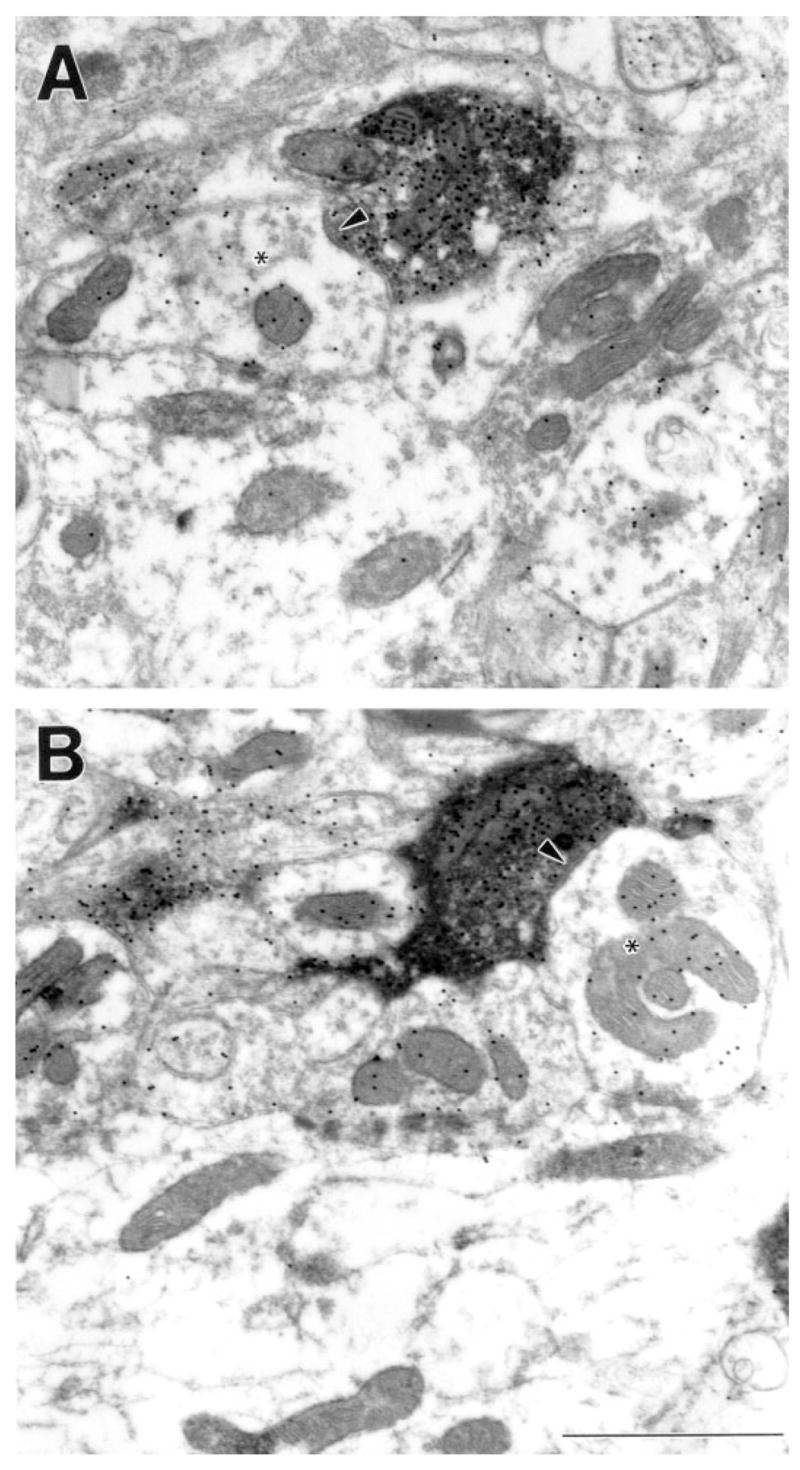
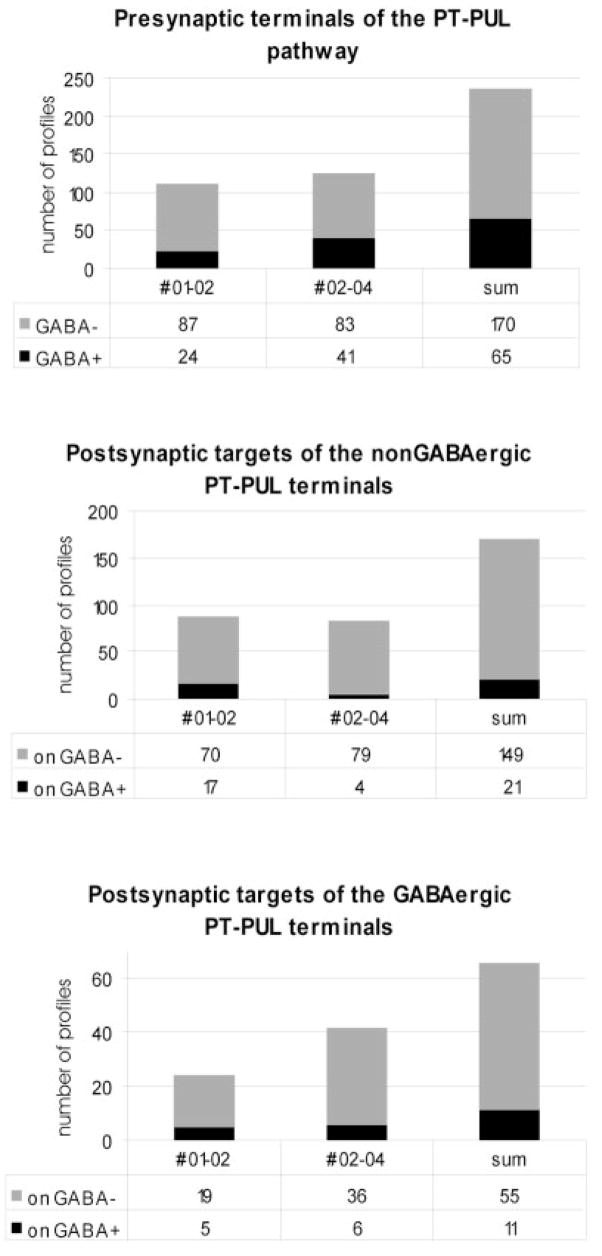
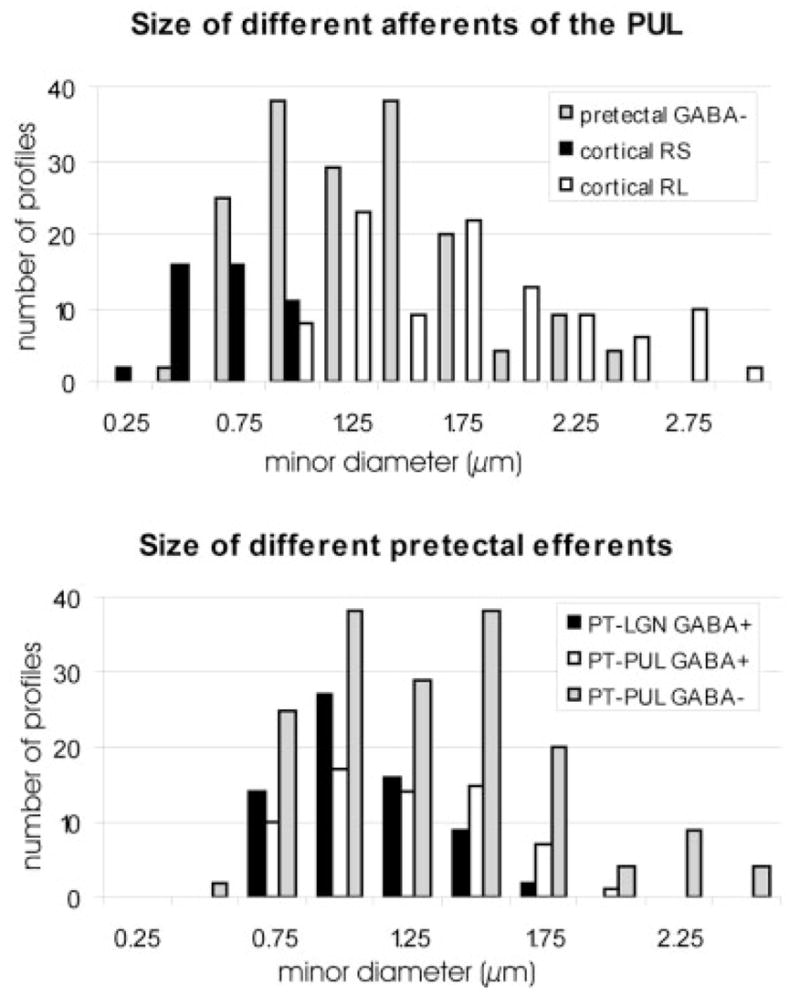
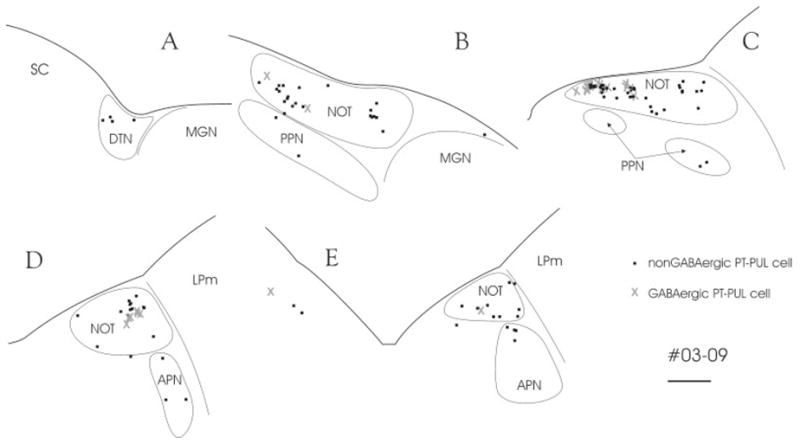
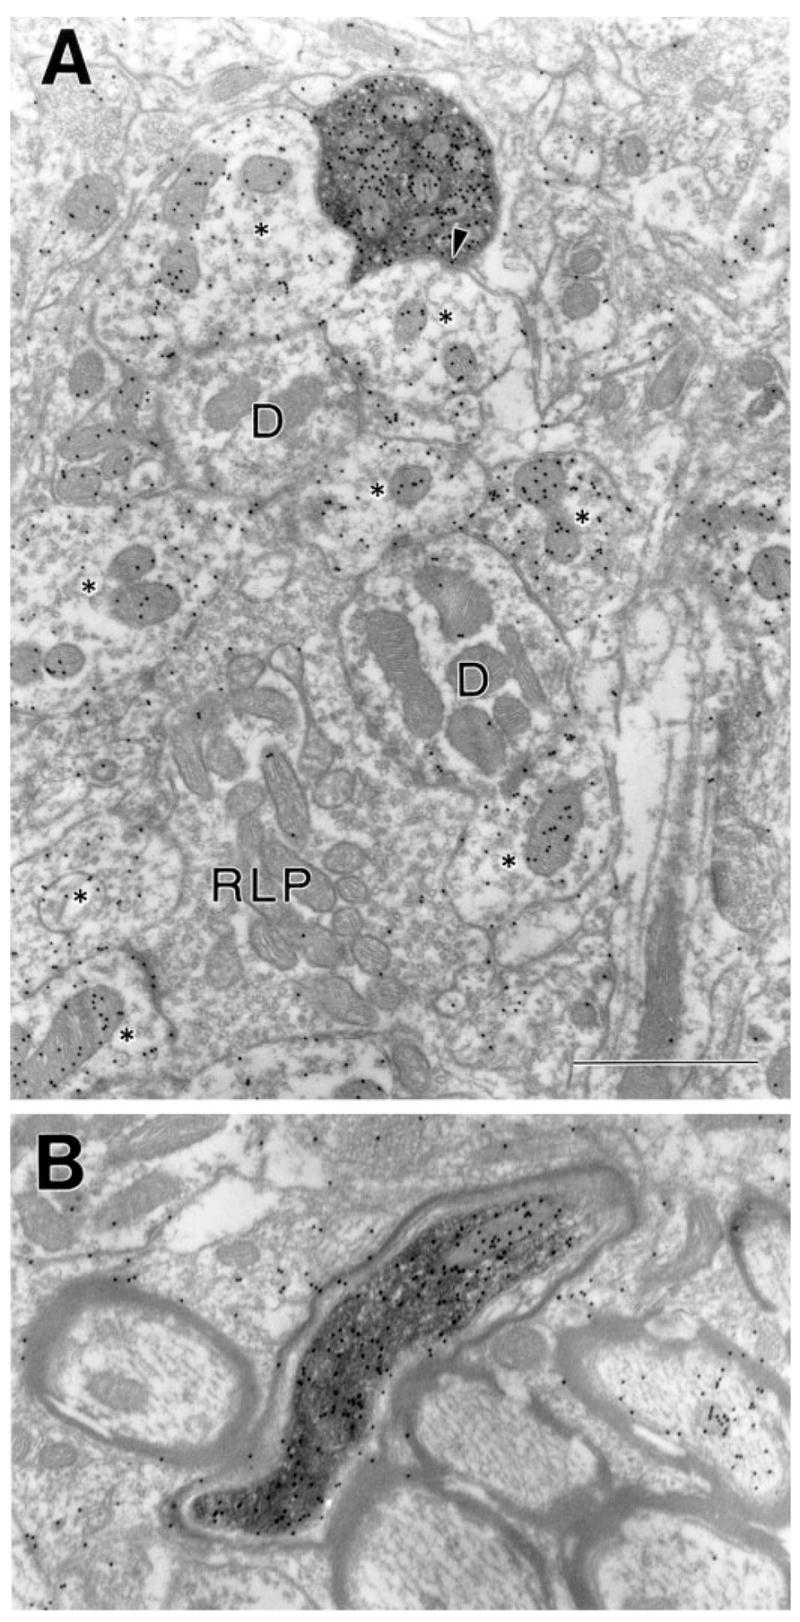
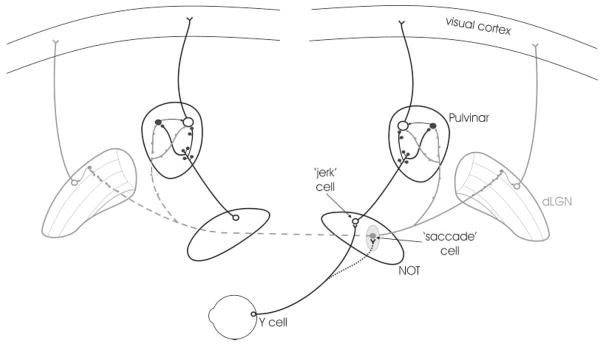
The pretectum (PT) can supply the pulvinar nucleus (PUL), and concomitantly the cortex, with visual motion information through its dense projections to the PUL. We examined the morphology and synaptic targets of pretecto-pulvinar (PT-PUL) terminals labeled by anterograde transport in the cat. By using postembedding immunocytochemical staining for gamma-aminobutyric acid (GABA), we additionally determined whether PT-PUL terminals or their postsynaptic targets were GABAergic. We found that the main projection from the PT to the PUL is an ipsilateral, non-GABAergic projection (72.4%) that primarily contacts thalamocortical cell dendrites (87.6%), and also the dendritic terminals of interneurons (F2 profiles; 12.4%). The PT additionally provides GABAergic innervation to the PUL (27.6% of the ipsilateral projection), which chiefly contacts relay cell dendrites (84.6%) but also GABAergic profiles (15.4%). These GABAergic pretectal terminals are smaller, beaded fibers that likely branch to bilaterally innervate the PUL and dLGN, and possibly other targets. We also examined the neurochemical nature of PT-PUL cells labeled by retrograde transport and found that most are non-GABAergic cells (79%) and devoid of calbindin. Taking existing physiological and our present morphological data into account, we suggest that, in addition to the parietal cortex, the non-GABAergic PT-PUL projection may also strongly influence PUL activity. The GABAergic pretectal fibers, however, may provide a more widespread influence on thalamic activity.


Figures

Fig. 1
Fig. 1
A–F: After an injection of fluorescein conjugated to dextran amine (black patch; case 03-01) in the PUL, numerous cells in the NOT, the APN, and the PPN are labeled by retrograde transport (black dots). Cells labeled by retrograde transport are also located in the TRN, vLGN, and DTN. A: A dense cluster of cells was labeled in the lateral HTh. The distance between sections is 0.6 mm, and panel A corresponds to A6.4 according to the Horsley–Clarke stereotaxic coordinates. For abbreviations, see list. Scale bar = 5 mm in D (applies to A–F).
Fig. 2
Fig. 2
A–C: After an injection of fluorescein conjugated to dextran amine in the PUL (A), cells in the PT are labeled by retrograde transport (B,C). Many of these cells extend dendrites throughout wide regions of the PT. For abbreviations, see list. Scale bars = 1 mm in A; 30 μm in C (applies to B).
Fig. 3
Fig. 3
Comparison of the size of PT-PUL neurons and Nissl-stained cells in the PT (03-01). The PT-PUL neurons are somewhat smaller than the overall population of pretectal neurons. For abbreviations, see list.
Fig. 4
Fig. 4
A,C: Calbindin was not detected in most pretectal cells labeled by the retrograde transport of tracers injected into the PUL. A: A merged photograph of the PT photographed with blue light to reveal PT-PUL cells (green fluorescent microspheres [GFM]) and green light to reveal cells labeled with a calbindin antibody (yellow/ red). C: A photomicrograph of a PT-PUL cell (black crystalline reaction product) in tissue subsequently stained for calbindin (homogenous brown reaction product). B: Glutamic acid decarboxylase (GAD) was not detected in PT-PUL cells. Shown is a merged photograph of the PT photographed with blue light to reveal PT-PUL cells (GFM) and green light to reveal cells labeled with a GAD antibody (red). D–F: γ-Aminobutyric acid (GABA) was detected in a subset of PT-PUL cells. Shown are photomicrographs of PT-PUL cells (black crystalline reaction product) in tissue subsequently stained for GABA (homogenous brown reaction product). For abbreviations, see list. Scale bars = 100 μm in A,B; 30 μm in C (applies to C–F).
Fig. 5
Fig. 5
A–G: After injections of green fluorescent microspheres (A–C; case 00-01) or wheat germ agglutinin-horseradish peroxidase (D–G; case 03-09) in the PUL, numerous pretectal cells are labeled by retrograde transport (black dots). These cells are primarily located outside of clusters of cells that contain calbindin (gray areas). Nevertheless, a few double-labeled cells can be seen (X). For abbreviations, see list. Section spacing is 600 μm. Scale bar = 1 mm in C (applies to A–G).
Fig. 6
Fig. 6
A–D: Injections of Phaseolus vulgaris leucoagglutinin (A; case 01-02) or biotinylated dextran amine (B; case 01-09) in the PT result in the anterograde labeling of a dense terminal field in the PUL (C,D). Terminals labeled after the injection illustrated in A and B are shown in C and D, respectively. For abbreviations, see list. Scale bar = 1 mm in A (applies to A,B); 100 μm in D (applies to C,D).
Fig. 7
Fig. 7
A–C: Injection of Phaseolus vulgaris leucoagglutinin (A; case 02-04) in the PT resulted in the anterograde labeling of a dense terminal field in the PUL (B), shown at higher magnification in C. D: Pretectal terminals in the A lamina of the dLGN are less dense than in the PUL, and all exhibit a varicose morphology. E,F: Similar varicose pretectal fibers are labeled in the LPl (E), and in the LPm (F) but are more sparsely distributed than in the dLGN. For abbreviations, see list. Scale bar = 250 μm in A (applies to A,B); 100 μm in C (applies to C–F).
Fig. 8
Fig. 8
A–D: The schematic plot illustrates the distribution of pretectal efferents labeled from an injection of Phaseolus vulgaris leucoagglutinin (case 02-04; gray zone; also depicted in Fig. 7A). The densest projections of the PT are the PUL, the zona incerta (ZI), the vLGN, and the contralateral PT. Varicose terminals are indicated by small dots. Small stars indicate clustered terminals. Section spacing is 1mm, and panel A corresponds to A4.0 according to the Horsley–Clarke stereotaxic coordinates. For abbreviations, see list. Scale bar = 1 mm in D (applies to A–D).
Fig. 9
Fig. 9
After injections of anterograde tracers in the PT (02-04R), two types of terminals are labeled in the PUL. A–C: Most PT-PUL terminals form clusters of terminal boutons. D: Other labeled axons exhibit a beaded morphology. For abbreviations, see list. Scale bars = 10 μm in A (applies to A–C),D.
Fig. 10
Fig. 10
The locations of tissue blocks prepared for ultrastructural examination are schematically indicated with gray squares. From the PUL, six samples were examined: blocks 1,2 of case 01-02L (top left), blocks 1,2 of case 02-04R (bottom left), block 1 of case 03-05R (top right), block 1 of case 02-04L (bottom middle). Tissue from the dLGN was taken from case 03-01R (bottom right). The approximate position of each section is indicated by Horsley–Clarke stereotaxic coordinates. For abbreviations, see list. Scale bar = 2 mm.
Fig. 11
Fig. 11
The histograms quantify the γ-aminobutyric acid (GABA) content within PT-PUL terminals, their postsynaptic elements, and large cortical terminals with round vesicles (RL) in two cases (01-02, 02-04). Using the mean gold particle density overlying selected RL profiles +2 standard deviations as an upper threshold for GABA-immunonegative profiles (vertical dashed line in the graph, and a double-headed arrow along the X axis), we estimated the number of GABAergic and non-GABAergic PT-PUL terminal and their target elements in the PUL. For abbreviations, see list.
Fig. 12
Fig. 12
A: Most PT-PUL terminals do not contain γ-aminobutyric acid (GABA), form clusters of terminal boutons, and participate in glomerular arrangements. B,C: Terminals in A are shown at higher magnification. Arrowheads indicate synaptic contacts. For abbreviation, see list. Scale bars = 10 μm in A,B (applies to B,C).
Fig. 13
Fig. 13
A γ-aminobutyric acid (GABA) -immunonegative PT-PUL terminal contacts (arrowheads) a GABA-immunonegative dendrite (D) and two GABA-immunoreactive profiles with vesicles (asterisks). A synaptic triad is formed by the synapse between one GABA-immunoreactive postsynaptic profile (asterisk, right) and the adjacent GABA-immunonegative dendrite (D). For abbreviation, see list. Scale bar = 1 μm.
Fig. 14
Fig. 14
A subset of PT-PUL terminals contains γ-aminobutyric acid (GABA). A,B: Shown are two examples of GABAergic PT-PUL terminals that contact (arrowheads) GABAergic profiles that contain vesicles (asterisks). For abbreviations, see list. Scale bar = 1 μm in B (applies to A,B).
Fig. 15
Fig. 15
The top histogram illustrates the proportion of γ-aminobutyric acid (GABA) -ergic and non-GABAergic PT-PUL terminals observed (cases 01-02, 02-04, and combined). The proportion of GABAergic and non-GABAergic profiles postsynaptic to non-GABAergic PT-PUL terminals is shown (middle, cases 01-02, 02-04, and combined), and the proportion of GABAergic and non-GABAergic profiles postsynaptic to GABAergic PT-PUL terminals is shown (bottom, cases 01-02, 02-04, and combined). For abbreviation, see list.
Fig. 16
Fig. 16
The top histogram compares the minor diameters of non–γ-aminobutyric acid (GABA) -ergic PT-PUL terminals (data from cases 01-02 and 02-04 combined) to two categories of corticopulvinar terminals labeled from area 7 (corticopulvinar data from Baldauf et al., 2005; cases 99-10 and 01-18 combined). The size range of PT-PUL terminals overlaps that of both small (RS) and large (RL) cortical terminals. The bottom histogram compares the minor diameters of non-GABAergic and GABAergic PT-PUL terminals to GABAergic PT-LGN terminals (measured from terminals reported by Wang et al. 2002a; cases 01-02 and 01-09 combined). The two types of GABAergic pretectal efferents are approximately the same size, whereas the non-GABAergic PT-PUL terminals are larger. For abbreviations, see list.
Fig. 17
Fig. 17
After an injection of wheat germ agglutinin-horseradish peroxidase in the PUL (03-09R), numerous pretectal cells are labeled by retrograde transport (black squares). A subset of these cells was labeled with an antibody against γ-aminobutyric acid (GABA, gray X). Section spacing is 600 μm. For abbreviations, see list. Scale bar = 1 mm.
Fig. 18
Fig. 18
A,B: In the dLGN, terminals (A) and axons (B) labeled after an injection of fluorescein conjugated to dextran amine in the PUL contain γ-aminobutyric acid (GABA). The labeled terminal contacts (arrow) a GABA-immunoreactive profile within a glomerulus composed of a retinal terminal (RLP), thalamocortical cell dendrites (D), and GABAergic profiles (asterisks). For abbreviations, see list. Scale bar = 1 μm in A (applies to A,B).
Fig. 19
Fig. 19
The schematic diagram summarizes the present findings and those of previous studies. We found that the main projection from the PT to the PUL is an ipsilateral, non–γ-aminobutyric acid (GABA) -ergic projection. The PT-PUL neurons are primarily located within the NOT (open circles) and are presumably identical to the “jerk” cells receiving retinal input from Y ganglion cells (Ballas and Hoffmann, 1985). The non-GABAergic PT-PUL terminals form large clustered boutons in the PUL and contact both thalamocortical cells (open circles) and interneurons (filled black circles). We also found that both the ipsilateral and contralateral PUL receives a diffuse GABAergic projection from presumably another set of pretectal neurons (filled gray circle), the “saccade” cells. These GABAergic terminals form smaller, beaded boutons that likely branch to bilaterally innervate the PUL and dLGN. In the dLGN, they contact mostly interneurons (filled gray circles), whereas in the PUL they contact both thalamocortical cells and interneurons. For abbreviations, see list.

References

    1. Baldauf ZB, Wang XP, Wang S, Bickford ME. Pretectotectal pathway: an ultrastructural quantitative analysis in cats. J Comp Neurol. 2003;464:141–158. - PubMed
    1. Baldauf ZB, Chomsung RD, Carden WB, May PJ, Bickford ME. Ultrastructural analysis of projections to the pulvinar nucleus of the cat. I: Middle suprasylvian gyrus (areas 5 and 7) J Comp Neurol. 2005;485:87–107. - PMC - PubMed
    1. Ballas I, Hoffmann KP. A correlation between receptive field properties and morphological structures in the pretectum of the cat. J Comp Neurol. 1985;238:417–428. - PubMed
    1. Berman N. Connections of the pretectum in the cat. J Comp Neurol. 1977;174:227–254. - PubMed
    1. Berson DM, Graybiel AM. Parallel thalamic zones in the LP-pulvinar complex of the cat identified by their afferent and efferent connections. Brain Res. 1978;147:139–148. - PubMed

Publication types

MeSH terms