Comparative Study
. 2005 May 2;485(2):87-107.
doi: 10.1002/cne.20480.

Ultrastructural analysis of projections to the pulvinar nucleus of the cat. I: Middle suprasylvian gyrus (areas 5 and 7)

Affiliations
Comparative Study

Ultrastructural analysis of projections to the pulvinar nucleus of the cat. I: Middle suprasylvian gyrus (areas 5 and 7)

Zsolt B Baldauf et al. J Comp Neurol. .

Abstract

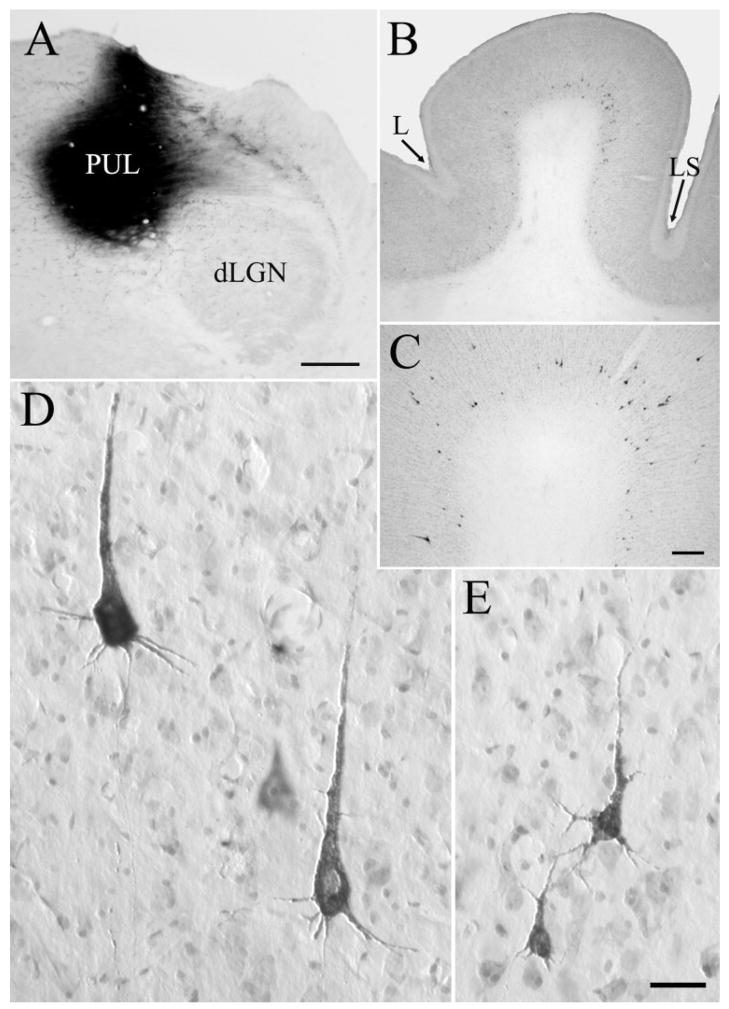
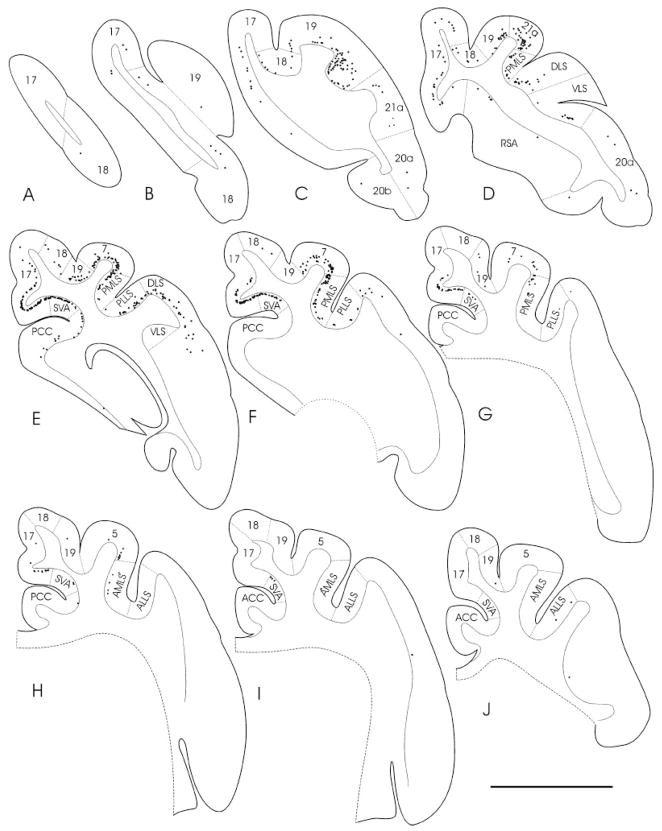
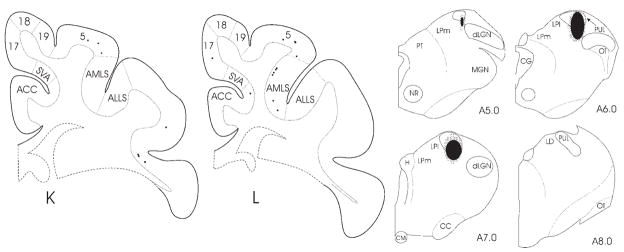
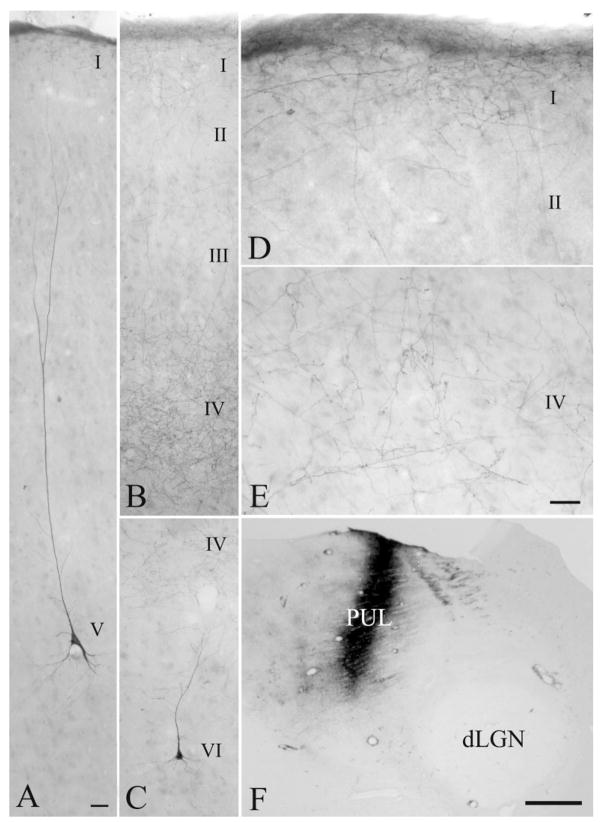
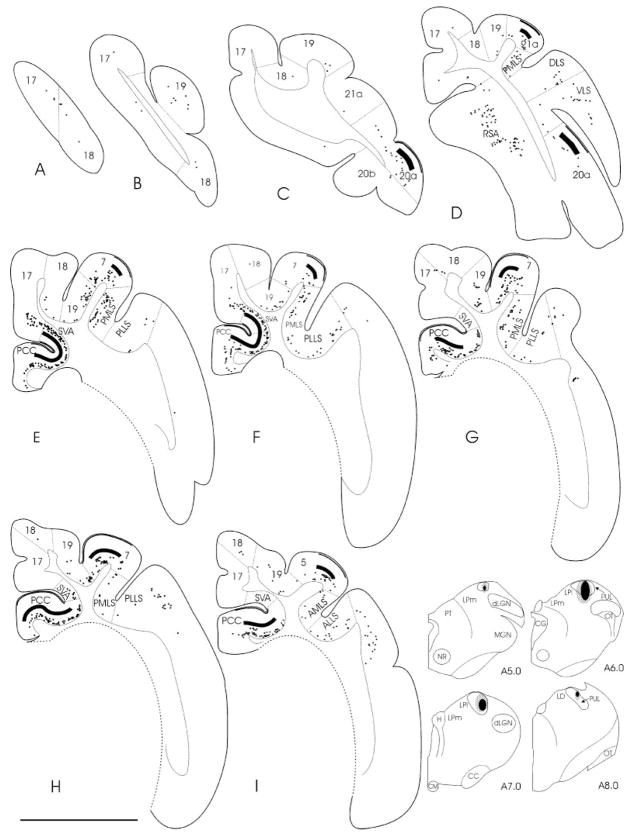
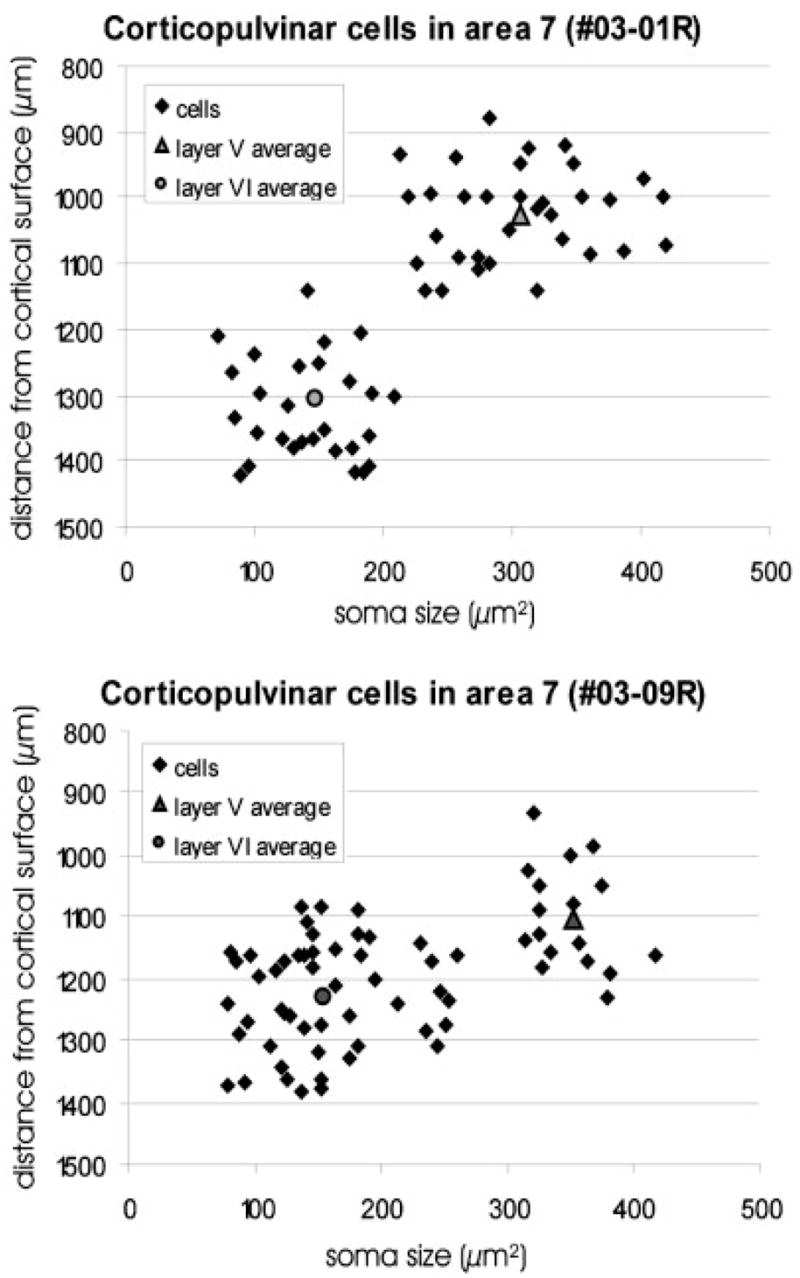
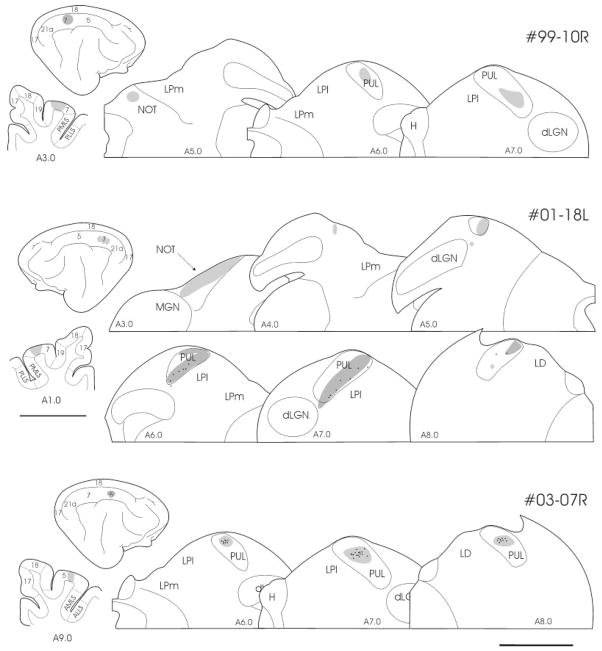
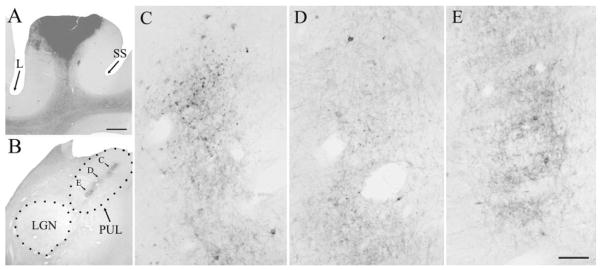
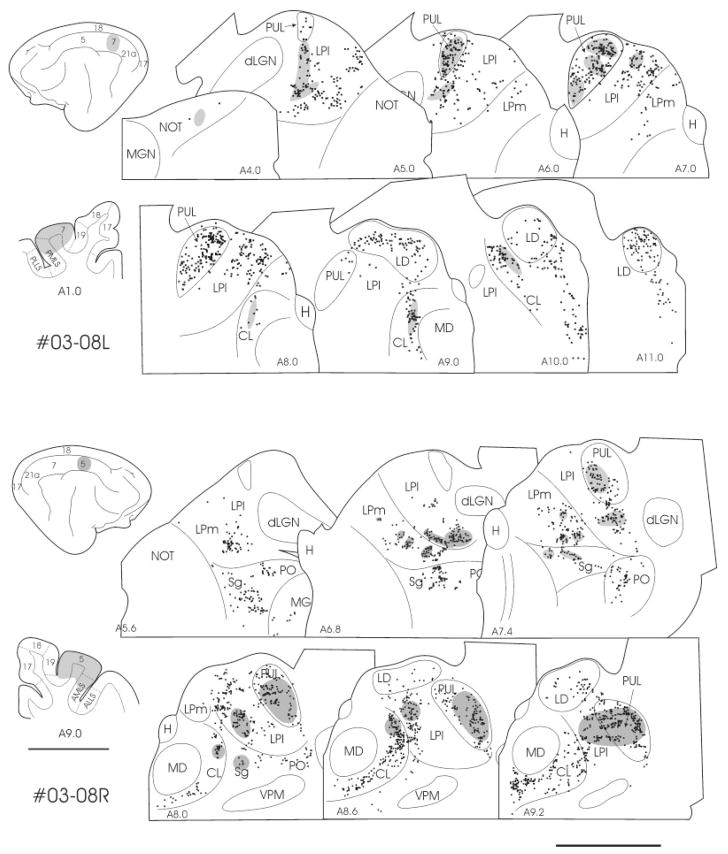
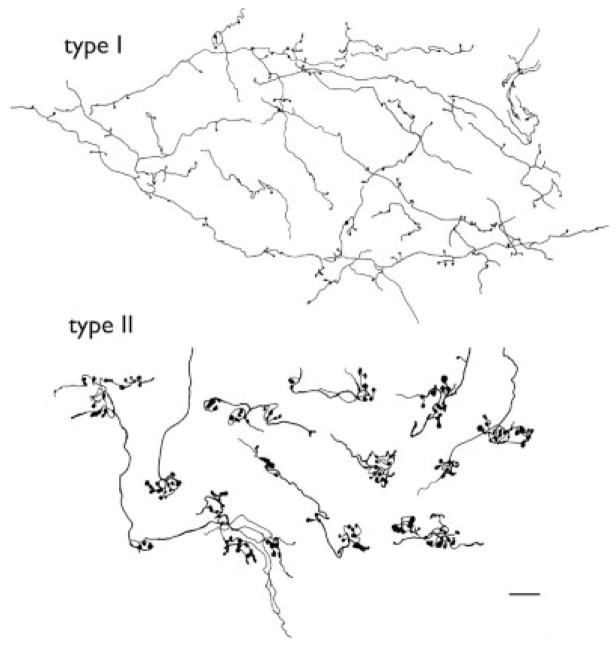
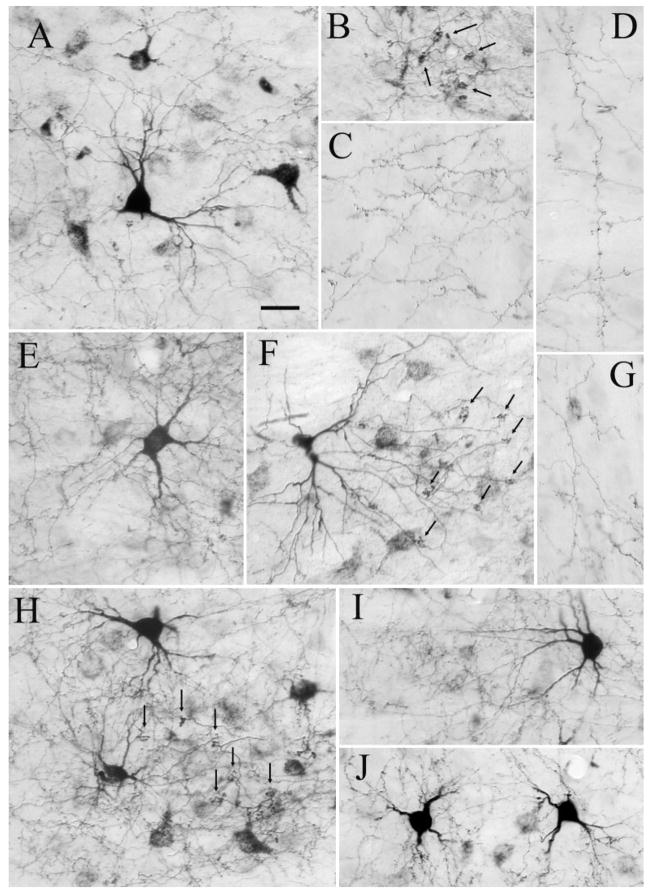
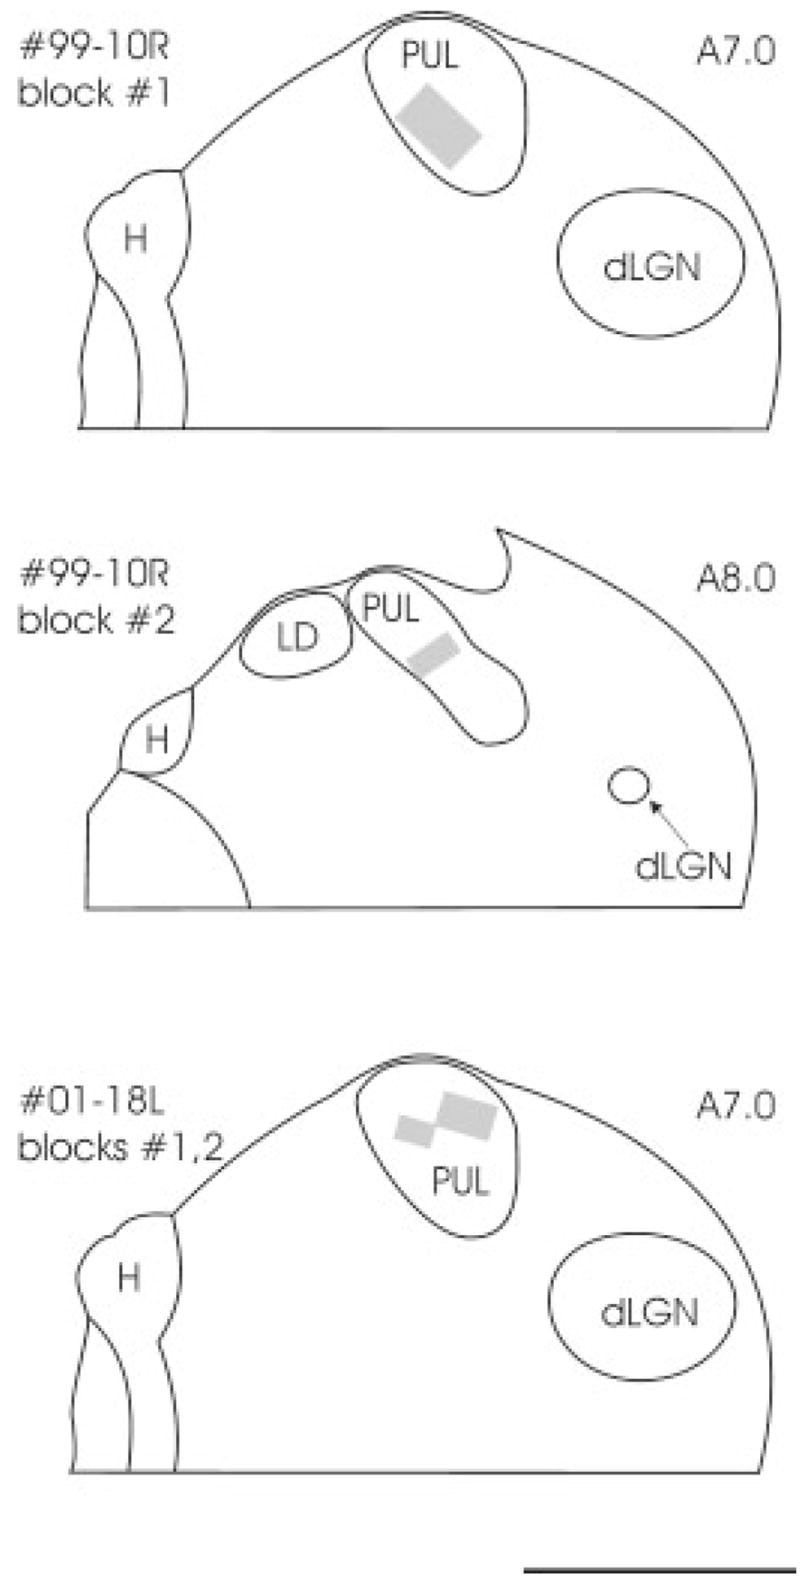
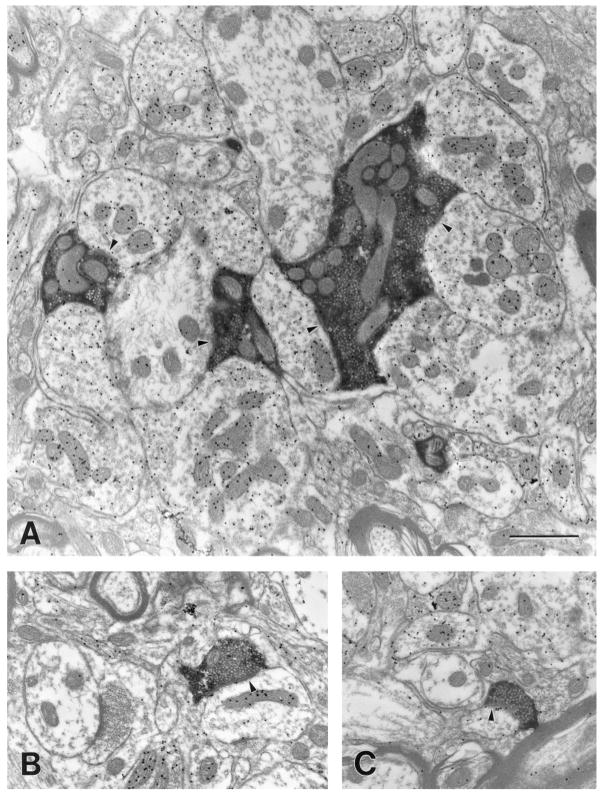
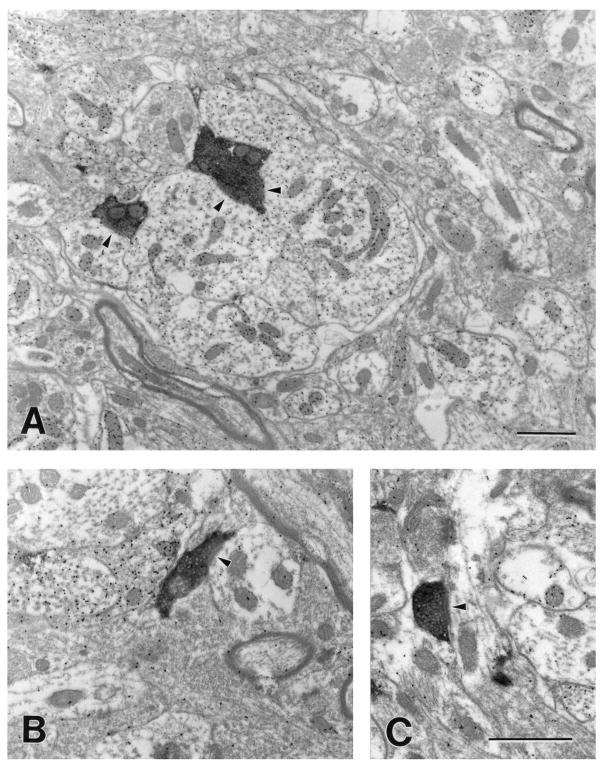
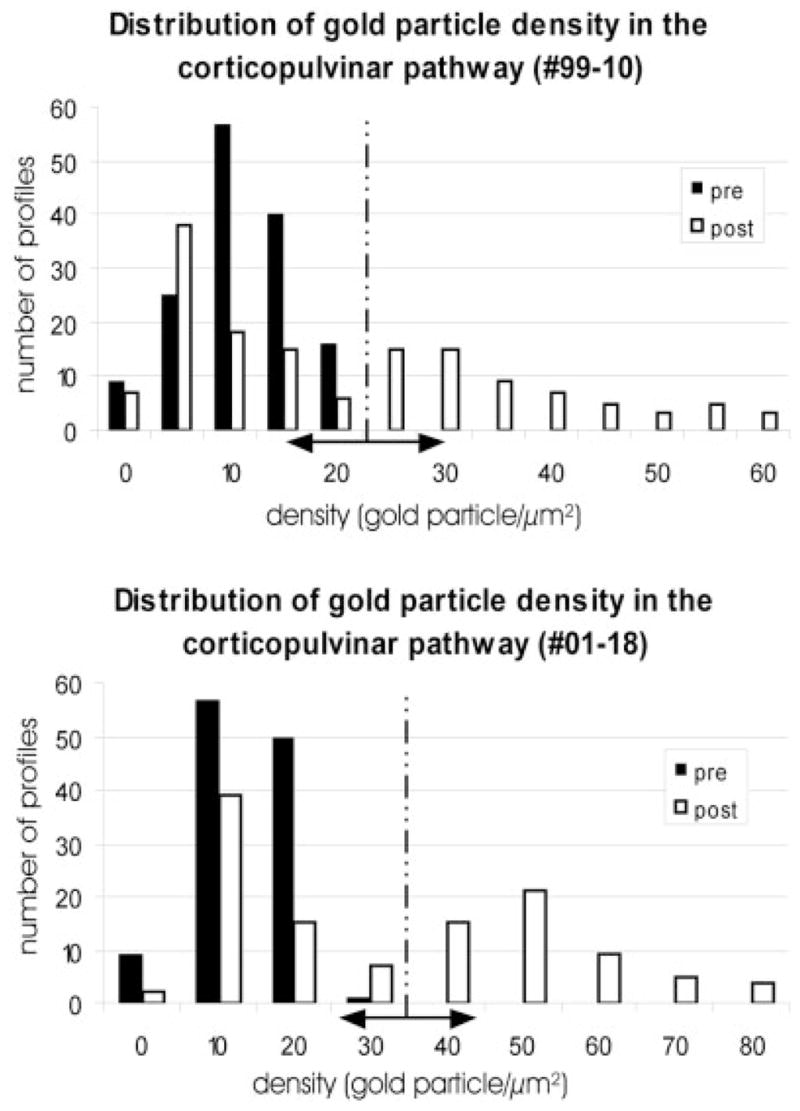
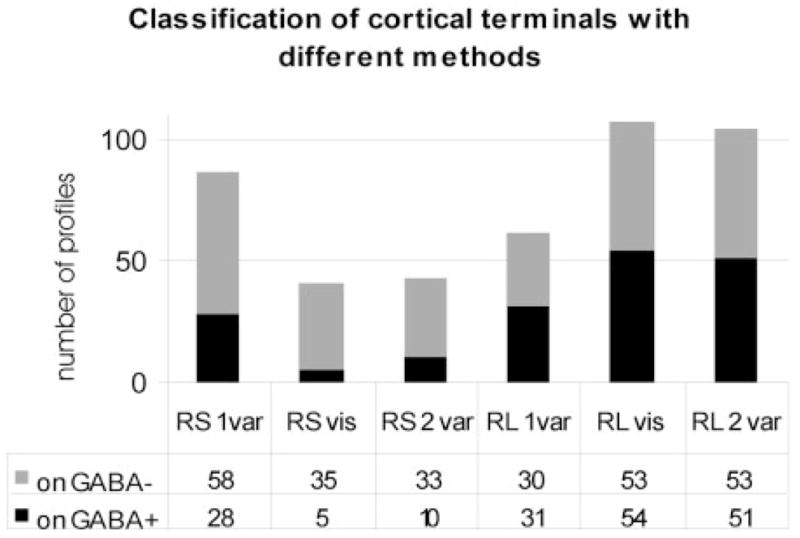
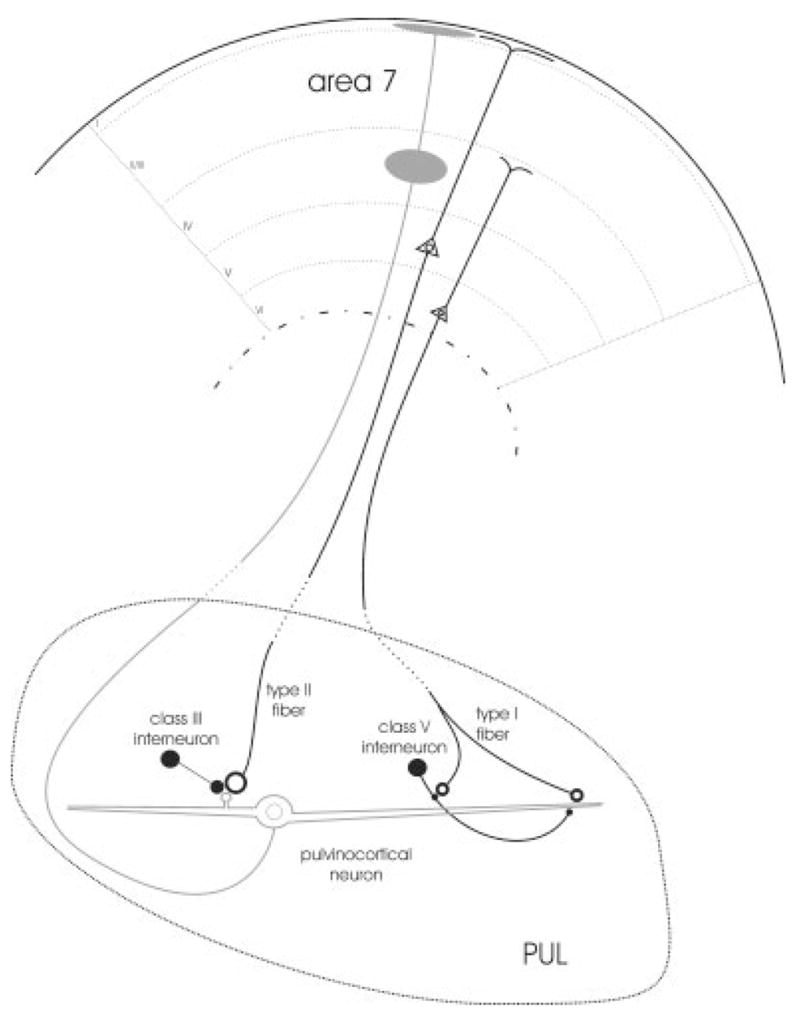
The mammalian pulvinar nucleus (PUL) establishes heavy interconnections with the parietal lobe, but the precise nature of these connections is only partially understood. To examine the distribution of corticopulvinar cells in the cat, we injected the PUL with retrograde tracers. Corticopulvinar cells were located in layers V and VI of a wide variety of cortical areas, with a major concentration of cells in area 7. To examine the morphology and distribution of corticopulvinar terminals, we injected cortical areas 5 or 7 with anterograde tracers. The majority of corticopulvinar axons were thin fibers (type I) with numerous diffuse small boutons. Thicker (type II) axons with fewer, larger boutons were also present. Boutons of type II axons formed clusters within restricted regions of the PUL. We examined corticopulvinar terminals labeled from area 7 at the ultrastructural level in tissue stained for gamma-aminobutyric acid (GABA). By correlating the size of the presynaptic and postsynaptic profiles, we were able to quantitatively divide the labeled terminals into two categories: small and large (RS and RL, respectively). The RS terminals predominantly innervated small-caliber non-GABAergic (thalamocortical cell) dendrites, whereas the RL terminals established complex synaptic arrangements with dendrites of both GABAergic interneurons and non-GABAergic cells. Interpretation of these results using Sherman and Guillery's recent theories of thalamic organization (Sherman and Guillery [1998] Proc Natl Acad Sci U S A 95:7121-7126) suggests that area 7 may both drive and modulate PUL activity.


Figures

Fig. 1
Fig. 1
A–C: Corticothalamic cells labeled by retrograde transport after an injection of wheat germ agglutinin– horseradish peroxidase into the PUL (A, case 03–09R) are distributed in layers V and VI of the MSg (B,C). Shown is tissue reacted with stabilized 3,3′,5,5′ tetramethylbenzidine (TMB) with a cresyl violet counterstain. D,E: Layer V corticopulvinar cells (D) are generally larger than layer VI corticopulvinar cells (E). For abbreviations, see list. Scale bars = 1 mm in A (applies to A,B); 250 μm in C; 30 μm in E (applies to D,E).
Fig. 2
Fig. 2
A–L: The distributions of corticothalamic cells (black squares) labeled by retrograde transport after an injection of wheat germ agglutinin– horseradish peroxidase into the PUL (reconstruction of the injection site is shown in the four sections to the right of L; case 03–09) are plotted in cortical sections. The first cortical section (A) corresponds to Horsley–Clarke coordinate P10.0. The distance between sections is 2.1 mm. Cortical sections rostral from the most anterior level (L) shown here did not contain labeled neurons. For abbreviations, see list. Scale bar = 10 mm.
Fig. 2
Fig. 2
A–L: The distributions of corticothalamic cells (black squares) labeled by retrograde transport after an injection of wheat germ agglutinin– horseradish peroxidase into the PUL (reconstruction of the injection site is shown in the four sections to the right of L; case 03–09) are plotted in cortical sections. The first cortical section (A) corresponds to Horsley–Clarke coordinate P10.0. The distance between sections is 2.1 mm. Cortical sections rostral from the most anterior level (L) shown here did not contain labeled neurons. For abbreviations, see list. Scale bar = 10 mm.
Fig. 3
Fig. 3
A,C,F: Corticopulvinar cells labeled after an injection of fluorescein conjugated to dextran amine in the PUL (F; case 03–01R), are observed in layer V, with dendrites that extend to layer I (A, cell in area 7) and layer VI, with dendrites that extend to layer IV (C, cell in area 7). B,D,E: Pulvinocortical terminals labeled from the same injection were primarily distributed in layers I and IV (B, terminals in the PCC, D,E, terminals in area 7). For abbreviations, see list. Scale bars = 30 μm in A (applies to A–C), E (applies to D,E); 1 mm in F.
Fig. 4
Fig. 4
A–I: The distributions of corticothalamic cells (black squares) labeled by retrograde transport and pulvinocortical terminals (black bars) labeled by anterograde transport after an injection of fluorescein conjugated to dextran amine into the PUL (reconstruction of the injection site is shown in the four sections to the right of I; case 03–01) are plotted in cortical sections. The first cortical section (A) corresponds to the Horsley–Clarke coordinate P10.0. The distance between sections is 2.1 mm. For abbreviations, see list. Scale bar = 10 mm for cortical sections; 12.5 mm for thalamic sections.
Fig. 5
Fig. 5
The soma size of corticopulvinar cells within area 7 and their distance from the cortical surface is plotted for the two cases (03–01, 03–09). The layer V cells are larger than the layer VI cells.
Fig. 6
Fig. 6
Injection of tracers in area 7 (top; case 99–10R; middle, case 018L) and area 5 (bottom; case 03–07R) are reconstructed on the cortical surface and in a coronal section of the visual cortex (on the left). The resulting distributions of corticothalamic and corticopretectal terminals labeled by anterograde transport are indicated schematically (gray patches) in a series of coronal sections through the diencephalon. Corticothalamic terminals were located primarily in the PUL and corticopretectal terminals were observed in the NOT. The approximate position of each section is indicated by Horsley–Clarke stereotaxic coordinates. For abbreviations, see list. Scale bar = 5 mm for the thalamic sections; 20 mm for the cortical sections.
Fig. 7
Fig. 7
A,B: Injection of fluorescein labeled dextran amine in area 7 (A, case 01–18L) resulted in the labeling of an elongated patch of corticothalamic terminals and occasional thalamocortical cells in the PUL (B). C, D, E: Higher magnification photomicrographs of three zones within this patch are shown (photograph locations indicated in B). For abbreviations, see list. Scale bars = 1 mm in A (applies to A,B); 100 μm in E (applies to C–E).
Fig. 8
Fig. 8
Large injections of tracers in area 7 (top; case 03–08L) and area 5 (bottom; case 03–08R) with involvement of the neighboring PMLS (top) and AMLS (bottom), are reconstructed on the cortical surface and in a coronal section of the visual cortex (on the left). The major distributions of terminals labeled by anterograde transport are indicated schematically with gray patches, and the distributions of cells that were most intensely labeled by retrograde transport are indicated by black dots in a series of coronal sections through the diencephalon. The densest distributions of corticothalamic terminals were located in the PUL, the LPl, the LD, the CL, and the Sg. Corticopretectal terminals were located in the NOT. The approximate position of each section is indicated by Horsley–Clarke stereotaxic coordinates. For abbreviations, see list. Scale bar = 5 mm for the thalamic sections (right); 20 mm for the cortical sections (left).
Fig. 9
Fig. 9
Camera lucida drawings of the two morphological types of corticopulvinar axons that were labeled by anterograde transport after injections in area 7 (from case 99–10). The type I axons are thin and give rise to small en passant boutons or bouton termineaux on the end of short side branches. The type II axons are thicker and give rise to grape-like clusters of large boutons. Scale bar = 10 μm.
Fig. 10
Fig. 10
A–J: Corticopulvinar terminals labeled by anterograde transport and pulvinocortical cells labeled by retrograde transport in case 03–08 are illustrated. C,D,G: Type I corticopulvinar axons distribute diffuse terminals either as en passant swellings or as single boutons at the end of short side branches. B,F,H: Type II corticopulvinar axons are thicker and give rise to dense clusters of large terminals (arrows). A,E,F,H–J illustrate the morphology of labeled pulvinocortical cells. Scale bar = 30 μm in A (applies to A–J).
Fig. 11
Fig. 11
The locations of tissue blocks of the PUL prepared for ultrastructural examination are schematically indicated with gray squares. The approximate position of each section is indicated by Horsley–Clarke stereotaxic coordinates. For abbreviations, see list. Scale bar = 2 mm.
Fig. 12
Fig. 12
Electron micrographs illustrate the ultrastructure of corticopulvinar terminals (case 99–10R). A: A large (RL) terminal participates in a glomerulus-like arrangement in which it contacts (arrowheads) a γ-aminobutyric acid (GABA) -immunonegative dendrite (low density of gold particles) and three GABA-immunoreactive profiles (high density of gold particles) that contain vesicles. B: A small (RS) terminal contacts (arrowhead) a GABA-immunoreactive dendrite that contains scattered vesicles. This dendrite is also contacted by an unlabeled RS profile. C: An RS terminal contacts (arrowhead) a small GABA-immunonegative dendrite. Scale bar = 1 μm in A (applies to A–C).
Fig. 13
Fig. 13
Electron micrographs illustrate the ultrastructure of corticopulvinar terminals (case 01–18L). A: A large (RL) terminal participates in a glomerulus-like arrangement in which it contacts (arrowheads) three γ-aminobutyric acid (GABA) -immunoreactive profiles (high density of gold particles) that contain vesicles. B,C: Small (RS) terminals contact (arrowheads) small GABA-immunonegative (low density of gold particles) dendrites. Scale bars = 1 μm A, C (applies to B,C).
Fig. 14
Fig. 14
The histograms illustrate the quantification of γ-aminobutyric acid (GABA) immunolabeling of labeled area 7 corticopulvinar terminals (pre) and their postsynaptic profiles (post) in the two cases examined (99–10R and 01–18L). Using the mean gold particle density overlying cortical terminals +2 standard deviations as an upper threshold for GABA-immunonegative profiles (vertical dashed line), we estimated the number of GABAergic and non-GABAergic profiles that were postsynaptic to labeled corticopulvinar terminals.
Fig. 15
Fig. 15
Scatter plots of the minor diameter of labeled corticopulvinar terminals as a function of the minor diameter of their postsynaptic targets (top left: 99–10R; top right: 01–18L) illustrate the correlation between the size of presynaptic and postsynaptic partners. The bisector (solid line) represents the summed vector of all the data points, and the normal (dotted line) represents the point that divides the two populations with the most significant difference. Using this method to divide the terminals into small terminal (RS) and large terminal (RL) profiles, the number of γ-aminobutyric acid (GABA) -ergic and non-GABAergic postsynaptic profiles was calculated and is illustrated in the bottom histograms.
Fig. 16
Fig. 16
The histogram compares the results of different methods of classification of cortical terminals (in case 99–10R). Using terminal size alone (1 var), the proportion of small terminal (RS) and large terminal (RL) profiles was different than when using terminal and postsynaptic profile size (2 var) or qualitative visual assessment (vis) to categorize the terminal types. The result of quantitative categorization using two variables was similar to the result using qualitative visual assessment. GABA, γ-aminobutyric acid.
Fig. 17
Fig. 17
The schematic diagram summarizes the reciprocal connections between the PUL and cortical area 7. Neurons in both layers V and VI of area 7 project to the PUL and presumably give rise type II and I axons, respectively. Type I axons primarily innervate the distal dendrites of pulvinocortical cells. Occasionally, small terminal profiles contact the dendrites of interneurons, presumably those of class V interneurons (Carden and Bickford, 2002). Type II axons gives rise to large terminals that innervate glomeruli where they contact approximately equal proportions of pulvinocortical cell dendrites and the dendritic terminals of interneurons (presumably those of class III interneurons). Pulvinocortical projections to area 7 terminate primarily in layers I and IV, where the apical dendrites of layer V and layer VI corticopulvinar cells arborize, respectively. For abbreviation, see list.

References

    1. Abramson BP, Chalupa LM. The laminar distribution of cortical connections with the tecto- and cortico-recipient zones in the cat’s lateral posterior nucleus. Neuroscience. 1985;15:81–95. - PubMed
    1. Amassian VE. Studies on organization of a somesthetic association area including a single unit analysis. J Neurophysiol. 1954;17:39–58. - PubMed
    1. Avendaño C, Rausell E, Reinoso-Suárez F. Thalamic projections to areas 5a and 5b of the parietal cortex in the cat: a retrograde horse-radish peroxidase study. J Neurosci. 1985;5:1446–1470. - PMC - PubMed
    1. Avendaño C, Stepniewska I, Rausell E, Reinoso-Suárez F. Segregation and heterogeneity of thalamic cell populations projecting to superficial layers of posterior parietal cortex: a retrograde tracer study in cat and monkey. Neuroscience. 1990;39:547–559. - PubMed
    1. Baldauf ZB, Muly EC, Bickford ME. Comparison of posterior cingulate cortex projections to the pulvinar and laterodorsal nuclei. Soc Neurosci Abstr. 2003;68.1

Publication types

MeSH terms