Comparative Study
. 2005 Mar 29;102(13):4795-800.
doi: 10.1073/pnas.0409882102. Epub 2005 Mar 18.

An initial strategy for the systematic identification of functional elements in the human genome by low-redundancy comparative sequencing

Affiliations
Comparative Study

An initial strategy for the systematic identification of functional elements in the human genome by low-redundancy comparative sequencing

Elliott H Margulies et al. Proc Natl Acad Sci U S A. .

Abstract

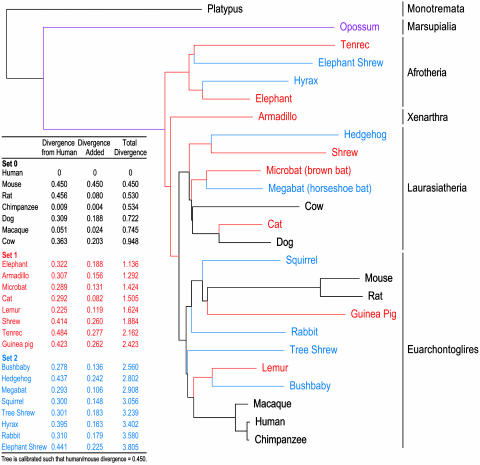
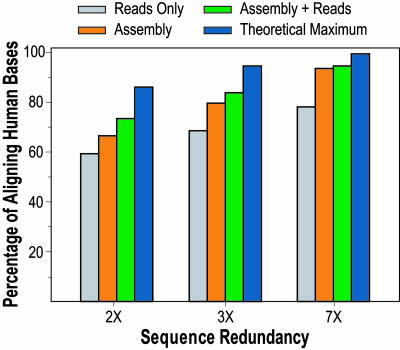
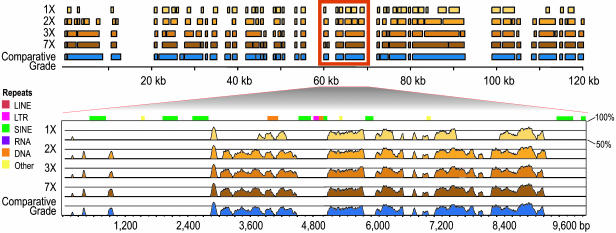
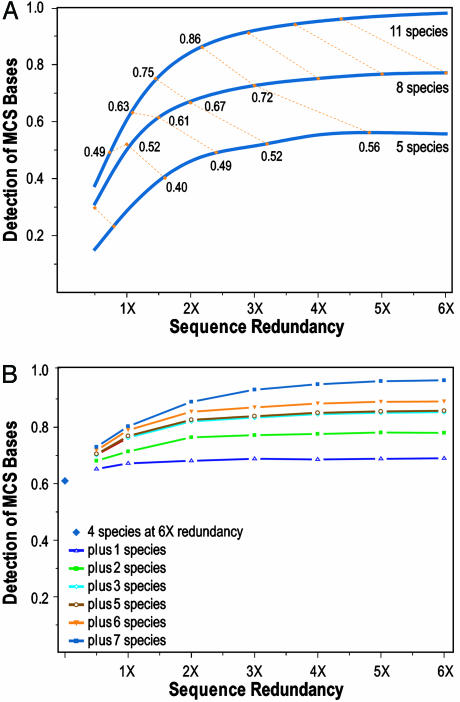
With the recent completion of a high-quality sequence of the human genome, the challenge is now to understand the functional elements that it encodes. Comparative genomic analysis offers a powerful approach for finding such elements by identifying sequences that have been highly conserved during evolution. Here, we propose an initial strategy for detecting such regions by generating low-redundancy sequence from a collection of 16 eutherian mammals, beyond the 7 for which genome sequence data are already available. We show that such sequence can be accurately aligned to the human genome and used to identify most of the highly conserved regions. Although not a long-term substitute for generating high-quality genomic sequences from many mammalian species, this strategy represents a practical initial approach for rapidly annotating the most evolutionarily conserved sequences in the human genome, providing a key resource for the systematic study of human genome function.


Figures

Fig. 1.
Fig. 1.
Phylogenetic tree of eutherian mammals proposed for genome sequencing. Various sets of eutherian mammals are shown: set 0 consisting of seven species for which high-redundancy genomic sequence is already available (black), set 1 consisting of an additional eight species proposed for sequencing (red), and set 2 consisting of a further eight species proposed for sequencing (blue). The tree also shows a marsupial (purple), for which genomic sequence is available, and a monotreme (gray). The Inset table lists each species, the branch length (divergence) relative to human (in substitutions per site), the increase in total branch length (D) provided by adding each species to those above, and the total branch length provided by that species combined with those above. Details about the phylogenetic tree and the associated branch lengths are provided in the supporting information, which is published on the PNAS web site and at www.nisc.nih.gov/data.
Fig. 2.
Fig. 2.
Characterization of alignments with various levels of sequence redundancy. Six regions of the mouse genome were studied, for which finished sequence was generated from bacterial artificial chromosome (BAC) clones (see supporting information for details). The sequence reads corresponding to these regions were extracted from whole-genome shotgun sequence data generated for the mouse genome (3). Subsets of these reads providing various levels of sequence redundancy (2×, 3×, and 7×) were then selected and assembled. The various data sets were then aligned to the human genome. The bar graph depicts the percentage of aligning bases, defined as the number of aligned human bases relative to the number obtained with finished mouse sequence. The different bars reflect alignments with all sequence reads before assembly (reads only); assembled sequence contigs containing two or more reads (assembly); assembled sequence contigs plus the remaining unassembled singleton reads (assembly + reads); and theoretical maximum attainable with indicated level of redundancy [calculated from the Lander-Waterman equation (12)].
Fig. 3.
Fig. 3.
Alignments obtained with various levels of sequence redundancy. High-quality sequence of a hedgehog BAC was used to illustrate alignments with lower-redundancy sequence data (see supporting information for details). “Comparative-grade” finished sequence (23) was generated for a BAC containing 120 kb of hedgehog genomic DNA. The data generated for that BAC were used to create subsets of sequence reads that provided various levels of sequence redundancy (1×, 2×, 3×, and 7×). The comparative-grade sequence and each of the unassembled subsets of sequence reads were then aligned to the orthologous region of the human genome, with the results shown at the top, as displayed with the Apollo viewer (24). An expanded view of a 10-kb interval is shown below, as displayed with the MultiVista viewer (25). Regions of the human genome without a hedgehog alignment largely reflect deletions in the hedgehog lineage or insertions in the human lineage since the most recent common ancestor of humans and hedgehogs. The divergence of hedgehog relative to human is estimated to be 0.44 (substitutions per site; see Fig. 1), roughly equivalent to that of mouse.
Fig. 4.
Fig. 4.
Identification of MCSs with various levels of sequence redundancy. (A) The finished sequences of ENCODE region ENm001 (7, 18, 22) from 11 mammalian species were used to identify a reference set of MCSs. MCS detection was then repeated with subsets of the data providing several lower levels of sequence redundancy (using both assembled sequence contigs and unassembled reads) for different subsets of mammals. The threshold was set to ensure 97% specificity for detecting the reference set of MCS bases. The performance of detecting MCSs with 5 (lemur, dog, horse, hedgehog, and mouse), 8 (the previous 5 plus pig, armadillo, and rabbit), or 11 (the previous 8 plus cat, cow, and rat) species is depicted by three smoothed curves statistically fit to the actual data (see supporting information). The yellow dotted lines connect “iso-read” equivalents (see text for details) for 5, 8, and 11 mammals, calculated for discrete increments of redundancy for 8 mammals (0.5- through 6-fold redundancy), with the indicated numbers reflecting the sensitivity of MCS detection for that data point. (B) Analogous studies were performed with region ENm005, but starting with 6-fold redundant sequence from 4 species for which whole-genome sequence is already available (dog, rat, mouse, and chicken) and then adding sequence from 7 additional species [in the order cat, cow, pig, fugu plus Tetraodon (pufferfish), galago, and baboon].

References

    1. Collins, F. S., Green, E. D., Guttmacher, A. E. & Guyer, M. S. (2003) Nature 422, 835-847. - PubMed
    1. Ohta, T. (1976) Nature 263, 74-76. - PubMed
    1. International Mouse Genome Sequencing Consortium (2002) Nature 420, 520-562. - PubMed
    1. Rat Genome Sequencing Project Consortium (2004) Nature 428, 493-521. - PubMed
    1. Bejerano, G., Pheasant, M., Makunin, I., Stephen, S., Kent, W. J., Mattick, J. S. & Haussler, D. (2004) Science 304, 1321-1325. - PubMed

Publication types