. 2005 Jun;32(6):521-30.
doi: 10.1165/rcmb.2005-0009OC. Epub 2005 Mar 18.

A surfactant protein C precursor protein BRICHOS domain mutation causes endoplasmic reticulum stress, proteasome dysfunction, and caspase 3 activation

Affiliations

A surfactant protein C precursor protein BRICHOS domain mutation causes endoplasmic reticulum stress, proteasome dysfunction, and caspase 3 activation

Surafel Mulugeta et al. Am J Respir Cell Mol Biol. 2005 Jun.

Abstract

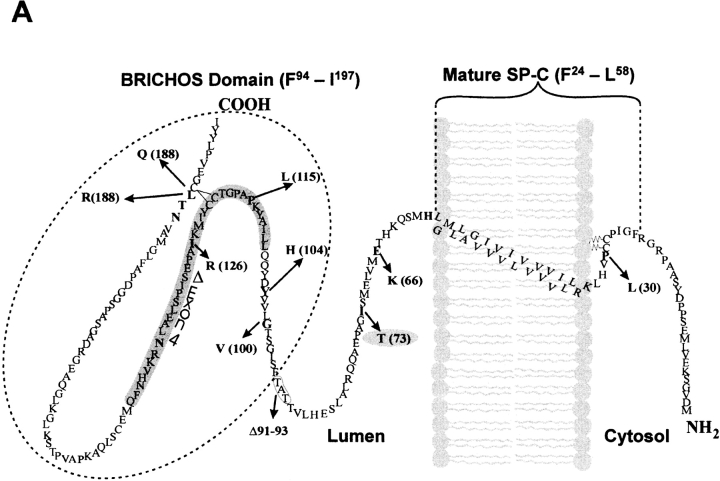
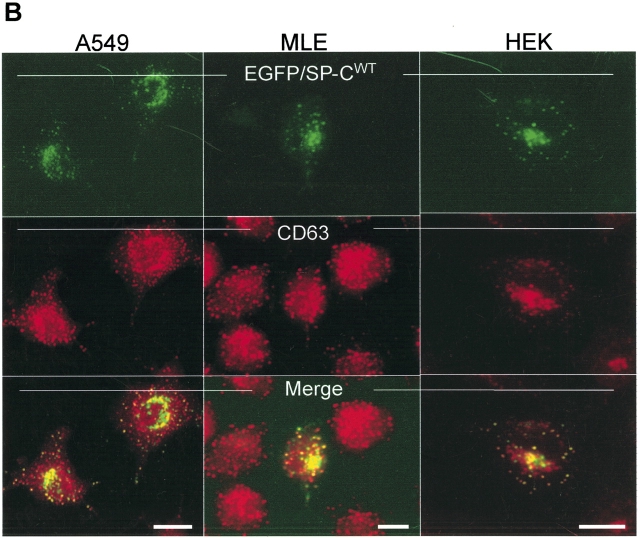
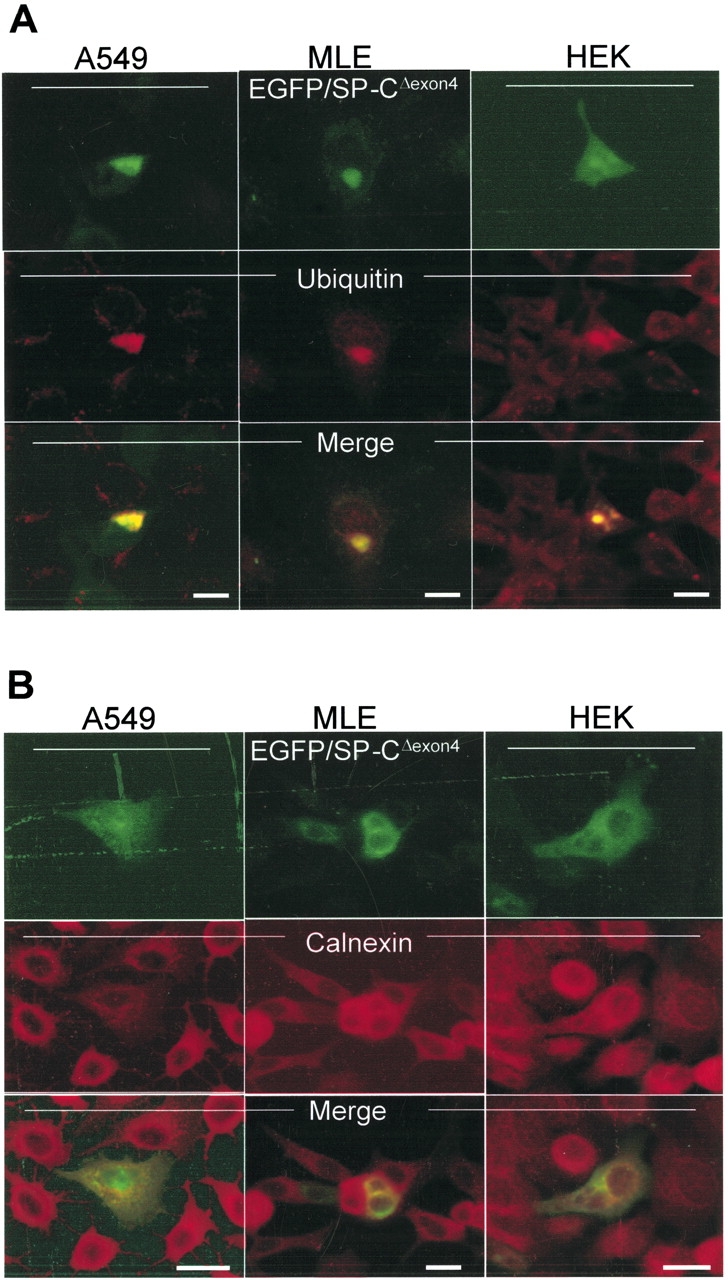
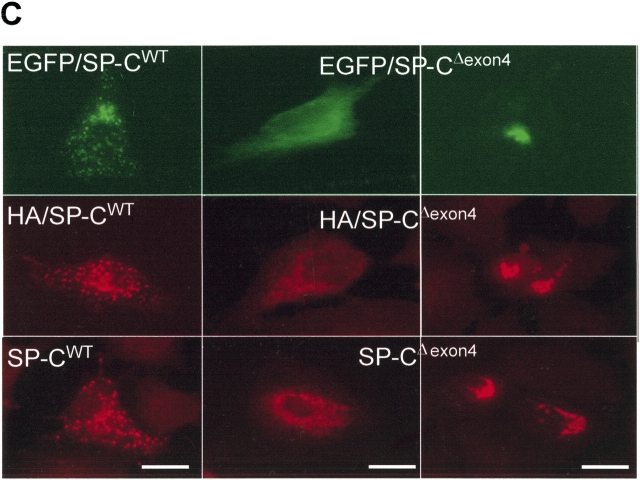
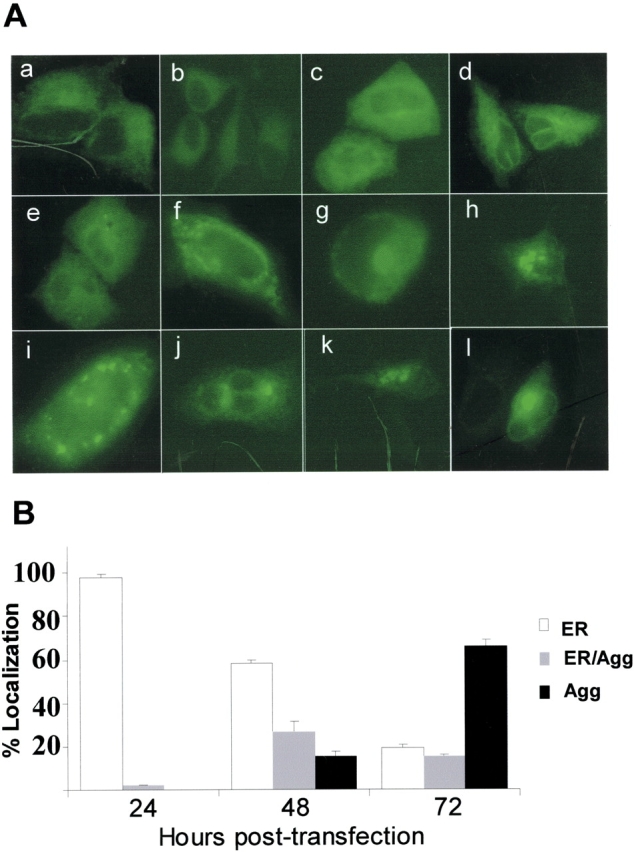
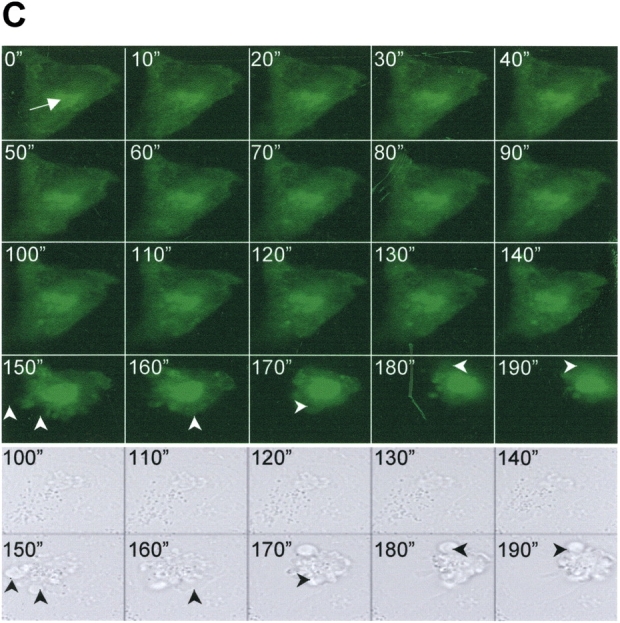
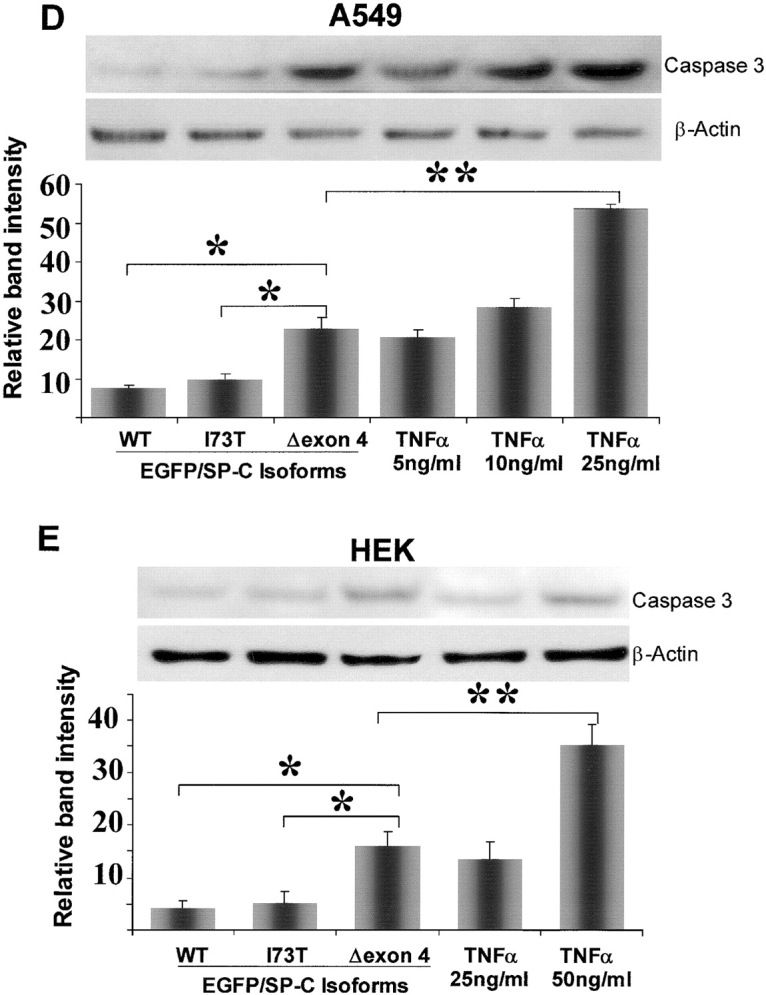
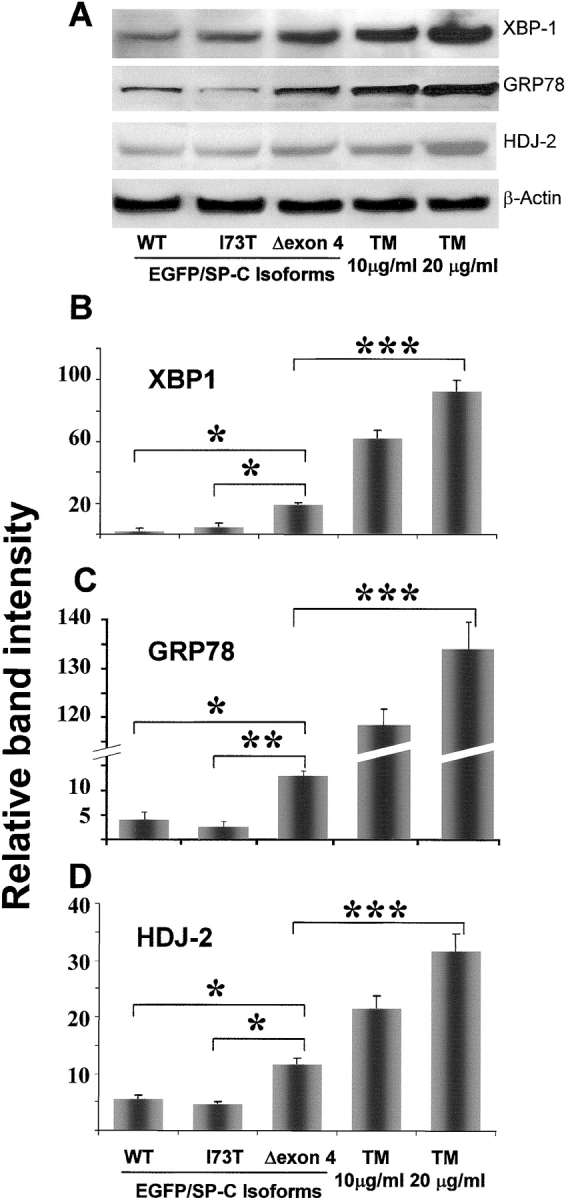
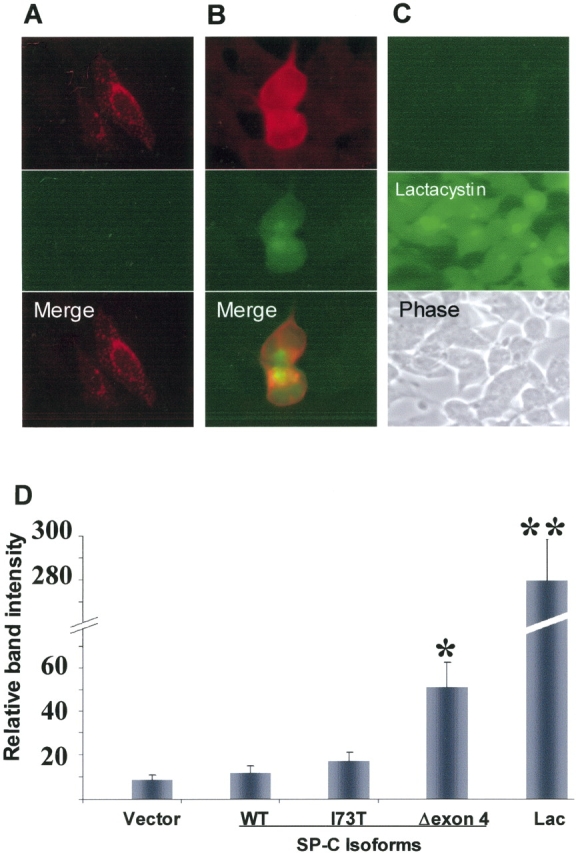
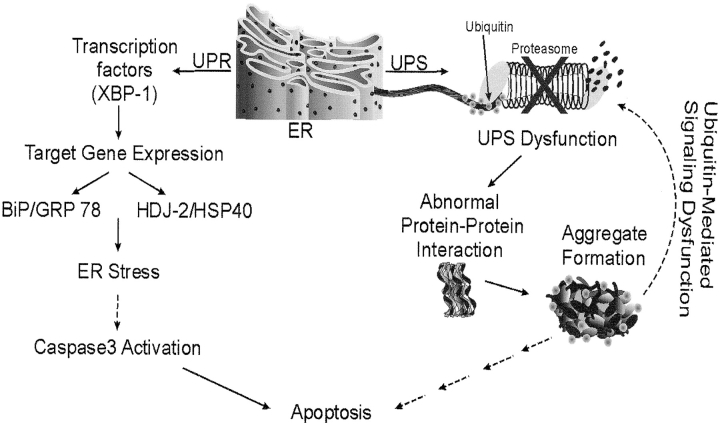
BRICHOS is a domain found in several proteins consisting of approximately 100 amino acids with sequence and structural similarities. Mutations in BRICHOS domain have been associated with both degenerative and proliferative diseases in several nonpulmonary organs, although the pathogenic mechanisms are largely undefined. Recently, several mutations in surfactant protein C (SP-C) mapping to the BRICHOS domain located within the proprotein (proSP-C) have been linked to interstitial lung diseases. In vitro expression of one of these BRICHOS mutants, the exon 4 deletion (hSP-CDeltaexon4), promotes a dominant-negative perinuclear aggregation of the protein. The present study characterizes the trafficking behavior and pathogenic consequences resulting from hSP-CDeltaexon4 expression. Time-lapse and co-localization microscopy studies demonstrated enhanced green fluorescent protein (EGFP)/hSP-CDeltaexon4 expression in calnexin-positive (endoplasmic reticulum [ER]) compartment with subsequent time- and concentration-dependent development of ubiquitinated perinuclear inclusion bodies followed by apoptosis. Compared with controls, EGFP/hSP-CDeltaexon4 promoted upregulation of multiple ER stress species, activated caspase 3, and induced annexin V binding. Furthermore, in GFP-u cells, hSP-CDeltaexon4 directly inhibited proteasome activity. These results support a model whereby proSP-C BRICHOS mutations induce a dynamic toxic gain-of-function, causing apoptotic cell death both by early ER accumulation leading to an exaggerated unfolded protein response and by enhanced deposition of cellular aggregates associated with proteasome dysfunction.


Figures

<b>Figure 1.</b>
Figure 1.
Wild-type SP-C is trafficked to vesicles distal to the Golgi independent of cell type. (A) Amino acid sequence of the human SP-C pro-protein showing cytosolic, transmembrane, luminal, and BRICHOS domains. The secreted mature SP-C, the BRICHOS domain (hatched oval circle), and mutations found in association with ILD are shown. The Δexon 4 BRICHOS domain mutation and a non–BRICHOS domain mutation analyzed in the present study are highlighted in gray. The BRICHOS domain flanks the C-terminal starting at phenylalanine 94. Amino acid nomenclature is based on the published SP-C sequence (31). (B) A549, MLE, and HEK cells transiently transfected with EGFP/SP-CWT (top row) show similarities in vesicular co-localization (bottom row) with Texas Red–conjugated CD63 (middle row) antibody. Bar, 5 μm.
<b>Figure 2.</b>
Figure 2.
EGFP/SP-CΔexon4 accumulates in the ER and forms cellular aggregates independent of conjugated marker tags. A549, MLE, and HEK cells transiently transfected with EGFP/SP-CΔexon4 (top rows) were immunostained with ubiquitin (A, middle row) and calnexin (B, middle row). In all three cell lines, both markers co-localize with the mutant (merged images). (C) Fluorescent images of A549 cells transfected with different plasmid constructs containing either EGFP-tagged (top row), HA-tagged (middle row), or untagged (bottom row) SP-CWT (left column) and SP-CΔexon4 (right two columns) isoforms immunostained with Texas Red–conjugated anti-HA (middle row) and anti-NPro (bottom row) antibodies. Bar, 5 μm.
<b>Figure 3.</b>
Figure 3.
Time-dependent trafficking and cell injury associated with SP-CΔexon4 expression. (A) Representative live fluorescent images of A549 cells at different time intervals following introduction of EGFP/SP-CΔexon4. Times are post-transfection: (a, b) 12 h with 2 min exposure time; (c, d) 24 h with 100 ms exposure time; (e–h) 36–48 h with 100 ms exposure time; (i–l) 48–72 h with 100 ms exposure time. Heterogeneous expression patterns of mutant proteins included ER localization (a–e), aggregation (h, j, k, and l), or combined ER localization and aggregation (f, g, and i). (B) Subcellular localization of EGFP/SP-CΔexon4 at 24, 48, and 72 h after transfection in A549 cells. Data were obtained from three separate experiments, each with counts of at least 300 transfected cells. (C) A representative time-lapse fluorescent imaging series of cellular response to the expression of EGFP/SP-CΔexon4 showing time-dependent development of aggregates and subsequent cell death (10-min intervals). Imaging was initiated at 47 h after transfection (t = 0 min) with apparent ER localized expression and initial formation of juxtanuclear aggregates (arrow). Onset of cell recoiling at t = 140 min (49 h and 20 min after transfection). Within the next hour, complete recoiling with concurrent dish-surface detachment and cell blebbing (arrowheads) (bottom rows of both fluorescent and phase images). Cell death following transfection of EGFP/SP- CΔexon4 ranged from 48–72 h.
<b>Figure 4.</b>
Figure 4.
Apoptotic cell death caused by EGFP/SP-CΔexon4 induction of Caspase 3. (A) EGFP/SP-CΔexon4–transfected A549 cells (top row) were immunostained with Texas Red–conjugated anti-activated caspase 3 (left column), Alexa 647–tagged annexin V (middle column), or nuclear-stained with propidium iodide (right column). Activated caspase 3 was present in cells expressing the mutant protein (left merged image). Plasma membrane phospatidylserine binding to annexin V was also observed in mutant protein-containing cells (middle merged image). Similarly, propidium iodide labeled nuclei of cells with mutant protein (right merged image). Phase contrasts of fluorescent images are shown (bottom row). Images represent results from at least three separate experiments. Bar, 5 μm. (B and C) Percentage of cell count showing significant immunostaining of activated caspase 3 (B) and nuclear labeling of propidium iodide (C) in cells transfected with EGFP/SP-CΔexon4 as compared with those transfected with vector (EGFPC1), EGFP/SP-CWT, or EGFP/SP-CI73T. Cells were counted 48 h and 72 h after transfection for caspase 3 and propidium iodide, respectively. Data were obtained from at least 250 transfected cells per construct over at least three separate experiments. *P < 0.001, **P < 0.005. Immunoblots of actived caspase 3 in lysates of A549 (D) and HEK (E) cells 48 h after transfection with various isoforms of EGFP/SP-C. Band intensity was quantified and results from at least three separate experiments are shown. Representative immunoblots appear above each graph. TNF-α was used as a positive control. For normalization, the band value of vector-transfected cells and the value of background intensity from the same experiment were subtracted from the measured intensity values for each construct or TNF-α. β-Actin bands were used to normalize for equal loading. *P < 0.005, **P < 0.001.
<b>Figure 5.</b>
Figure 5.
Induction of ER stress species by SP-CΔexon4. (A) Representative immunoblot bands of samples from A549 whole cell lysates showing increased transcription of XBP-1, GRP78, and HDJ-2 48 h after transfection in cells with EGFP/SP-CΔexon4 compared with those with either EGFP/SP-CWT or EGFP/SP-CI73T. TM-treated A549 cells were used as a positive control. Relative band intensity from at least three experiments is shown for XBP-1 (B), GRP78 (C), and HDJ-2 (D) expression in cells transfected with EGFP/SP-CΔexon4, SP-CWT, and SP-CI73T. Variable intensity of ER stress species in response to positive control (TM-treated cells) is shown. For normalization, the band value of vector-transfected cells and the value of background intensity from the same experiment were subtracted from the measured intensity values for each construct or TM. β-Actin bands were used to normalize for equal loading. *P < 0.005, **P < 0.001, ***P < 0.0005.
<b>Figure 6.</b>
Figure 6.
Proteasome inhibition by SP-CΔexon4. Representative GFPu-1 cells transfected with either SP-CWT (A) or SP-CΔexon4 (B) untagged SP-C isoforms. Immunostaining with anti-NPro (A and B, top row) antibody 48 h following plasmid introduction. Control GFPu-1 cell population before (C, top) and after (C, middle) treatment with lactacystin (Lac) with GFP expression only after treatment. Phase contrast image is shown (C, bottom). (D) Histogram of quantified immunoblot (using anti-GFP) from whole lysate samples of GFPu-1 cells transfected with either pcDNA3 (vector), or untagged isoforms of SP-C. Significant GFP expression is apparent in SP-CΔexon4–transfected cells compared with SP-CWT, SP-CI73T, or vector. Expression of large amounts of GFP in control cells treated with lactacystin (Lac) (right bar) is consistent with the fluorescent imaging results (C, middle). Data were obtained from three separate experiments, each consisting of at least two culture dishes per construct. *P < 0.05, **P < 0.001.
<b>Figure 7.</b>
Figure 7.
Dual effect of the SP-C BRICHOS domain mutant leading to cellular dysfunction. At least two separate subcellular systems are affected by BRICHOS domain mutant expression: the UPR and UPS pathways. UPR: Mutant expression induces ER stress as demonstrated by ER retention of misfolded proteins, increased expression of the transcription factor XBP-1, and upregulation of chaperone genes GRP78 and HDJ2. Consequently, through undefined intermediates, caspase 3 is activated with subsequent apoptotic cell death. UPS: Persistent production of misfolded proteins overwhelms the UPS and prevents normal homeostatic degradation of proteins resulting in cellular accumulation and aggregation of proteins. Aggregation is enhanced in the case of proteins in which heteromeric association between wild type and mutant isoforms results in a dominant negative effect, as seen with SP-CΔexon4. Inhibition of UPS not only promotes the accumulation of degradation-destined proteins, but also impedes other signaling pathways including those mediated by ubiquitin. Such subcellular system dysfunction is likely to cause cell injury and, ultimately, cell death. Hatched arrows indicate undefined intermediates.

References

    1. Beers M. Molecular processing and cellular metabolism of surfactant protein C. In: Rooney SA, editor. Lung surfactant: cellular and molecular processing. Austin: R.G. Landes; 1998. pp. 93–124.
    1. Johansson J. Structure and properties of surfactant protein C. Biochim Biophys Acta 1998;1408:161–172. - PubMed
    1. Weaver TE. Synthesis, processing and secretion of surfactant proteins B and C. Biochim Biophys Acta 1998;1408:173–179. - PubMed
    1. Sanchez-Pulido L, Devos D, Valencia A. BRICHOS: a conserved domain in proteins associated with dementia, respiratory distress and cancer. Trends Biochem Sci 2002;27:329–332. - PubMed
    1. Vidal R, Frangione B, Rostagno A, Mead S, Revesz T, Plant G, Ghiso J. A stop-codon mutation in the BRI gene associated with familial British dementia. Nature 1999;399:776–781. - PubMed

Publication types

MeSH terms