. 2005 Mar;144(6):875-84.
doi: 10.1038/sj.bjp.0706045.

Synergistic and additive interactions of the cannabinoid agonist CP55,940 with mu opioid receptor and alpha2-adrenoceptor agonists in acute pain models in mice

Affiliations

Synergistic and additive interactions of the cannabinoid agonist CP55,940 with mu opioid receptor and alpha2-adrenoceptor agonists in acute pain models in mice

Shao M Tham et al. Br J Pharmacol. 2005 Mar.

Abstract

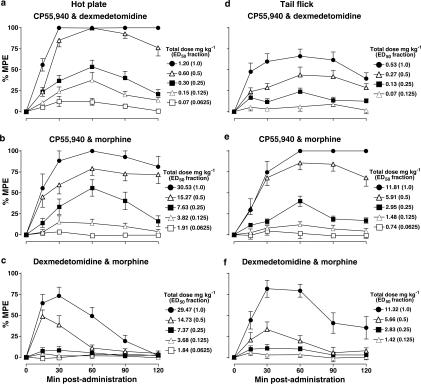
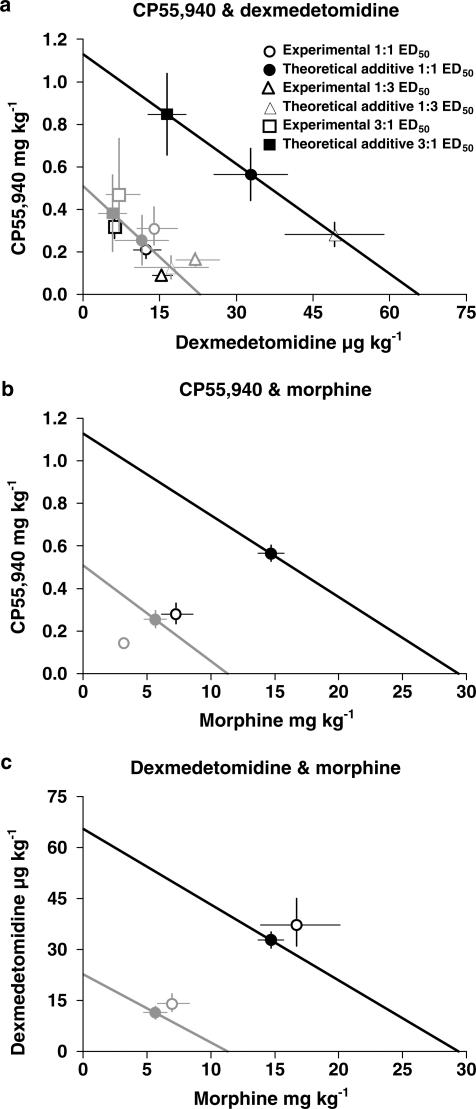
1. Cannabinoid receptor agonists elicit analgesic effects in acute and chronic pain states via spinal and supraspinal pathways. We investigated whether the combination of a cannabinoid agonist with other classes of antinociceptive drugs exerted supra-additive (synergistic) or additive effects in acute pain models in mice. 2. The interactions between the cannabinoid agonist CP55,940, alpha2-adrenoceptor agonist dexmedetomidine and mu-opioid receptor agonist morphine were evaluated by isobolographic analysis of antinociception in hot plate (55 degrees C) and tail flick assays in conscious male Swiss mice. Drug interactions were examined by administering fixed-ratio combinations of agonists (s.c.) in 1:1, 3:1 and 1:3 ratios of their respective ED50 fractions. 3. CP55,940, dexmedetomidine and morphine all caused dose-dependent antinociception. In the hot plate and tail flick assays, ED50 values (mg kg(-1)) were CP55,940 1.13 and 0.51, dexmedetomidine 0.066 and 0.023, and morphine 29.4 and 11.3, respectively. Synergistic interactions existed between CP55,940 and dexmedetomidine in the hot plate assay, and CP55,940 and morphine in both assays. Additive interactions were found for CP55,940 and dexmedetomidine in the tail flick assay, and dexmedetomidine and morphine in both assays. 4. Thus, an alpha2-adrenoceptor agonist or mu opioid receptor agonist when combined with a cannabinoid receptor agonist showed significant synergy in antinociception in the hot plate test. However, for the tail flick nociceptive response to heat, only cannabinoid and mu opioid receptor antinociceptive synergy was demonstrated. If these results translate to humans, then prudent selection of dose and receptor-specific agonists may allow an improved therapeutic separation from unwanted side effects.


Figures

Figure 1
Figure 1
Dose- and time-dependent antinociceptive effects of single s.c. bolus administration of CP55,940 (0.1–3 mg kg−1; top panels), dexmedetomidine (3–100 μg kg−1; middle panels) and morphine (3–50 mg kg−1; bottom panels) in the hot plate (panels a–c) and tail flick (d–f) assays in conscious mice. Responses are expressed as %MPE (see Methods) from 0 min (bolus injection) to 120 min postadministration; symbols are mean±s.e.m. For each agonist dose, n values in the hot plate and tail flick assays, respectively, were as follows: CP55,940 n=8–16 and 7–11; dexmedetomidine n=10–12 and 6–12; and morphine n=6–8 and 6–12. %MPE values at the time point at which the greatest antinociceptive responses were observed for each respective agonist (60 min for CP55,940 and morphine; 30 min for dexmedetomidine) were used to plot the dose–response curves shown in Figure 2.
Figure 2
Figure 2
Agonist dose–antinociceptive response curves (single agonist administration s.c.) in the (a) hot plate and (b) tail flick assays in conscious mice. Responses are expressed as %MPE (see Methods). %MPE values at the time point at which peak antinociceptive responses were observed for each respective agonist (see Figure 1) were used to plot the curves. The total n values for each agonist curve in the hot plate and tail flick assays, respectively, were as follows: CP55,940 n=50 and 33; dexmedetomidine n=57 and 46; and morphine n=34 and 40. For each agonist dose, n values in the hot plate and tail flick assays, respectively, were as follows: CP55,940 n=8–16 and 7–11; dexmedetomidine n=10–12 and 6–12; and morphine n=6–8 and 6–12. Symbols are mean±s.e.m.
Figure 3
Figure 3
Dose- and time-dependent antinociceptive effects of paired combinations of CP55,940, dexmedetomidine and morphine in the hot plate (panels a–c) and tail flick (d–f) assays in conscious mice. Responses are expressed as %MPE (see Methods) from 0 min (bolus coadministration) to 120 min postadministration; symbols are mean±s.e.m. The total dose indicated is the sum of the doses of the two drugs being used in combination (mg kg−1). The combinations were of equal fractions (1.0, 0.5, 0.25, 0.125 or 0.0625) of each paired agonist's respective ED50 value (see Table 1) coadministered in a fixed 1 : 1 ratio of the ED50 of agonist A : ED50 of agonist B. For each curve, total n values in the hot plate and tail flick assays, respectively, were as follows: CP55,940 and dexmedetomidine n=52 and 38; CP55,940 and morphine n=57 and 45; and dexmedetomidine and morphine n=65 and 41. For each agonist dose combination, n values in the hot plate and tail flick assays, respectively, were as follows: CP55,940 and dexmedetomidine n=7–13 and 7–11; CP55,940 and morphine n=8–13 and 3–12; and dexmedetomidine and morphine n=12–16 and 10–11. %MPE values at the time point at which the greatest antinociceptive responses were observed for each respective combination (a, b, d, e: 60 min; c, f: 30 min) were used to plot the combination dose–response curves shown in Figure 4.
Figure 4
Figure 4
Agonist dose–antinociceptive response curves for paired combinations of CP55,940, dexmedetomidine and morphine (s.c.) in the (a) hot plate and (b) tail flick assays in conscious mice. Responses are expressed as %MPE (see Methods). %MPE values at the time point at which peak antinociceptive responses were observed for each respective agonist (see Figure 3) were used to plot the curves. The total dose for each agonist combination is shown on the x-axis. Combinations were of equal fractions (1.0, 0.5, 0.25, 0.125 or 0.0625) of each paired agonist's respective ED50 value (see Table 1) coadministered in a fixed 1 : 1 ratio of the ED50 of agonist A : ED50 of agonist B. For each curve, total n values in the hot plate and tail flick assays, respectively, were as follows: CP55,940 and dexmedetomidine n=52 and 38; CP55,940 and morphine n=57 and 45; and dexmedetomidine and morphine n=65 and 41. For each agonist dose, n values in the hot plate and tail flick assays, respectively, were as follows: CP55,940 and dexmedetomidine n=7–13 and 7–11; CP55,940 and morphine n=8–13 and 3–12; and dexmedetomidine and morphine n=12–16 and 10–11. Symbols are mean±s.e.m.
Figure 5
Figure 5
Isobolograms for the effects of simultaneous s.c. administration of drug combinations (in 1 : 1 fixed ratio of ED50 of drug A : ED50 of drug B) in the hot plate (panels a–c) and tail flick (d–f) assays in conscious mice. The line in each panel connects the ED50 of drug A on the x-axis and the ED50 of drug B on the y-axis and represents the locus of points of dose combinations for purely additive interactions. Symbols represent theoretical additive and experimental ED50 values, with their associated 95% confidence intervals. The drug combinations (and interactions) were as follows: (a, d) CP55,940 and dexmedetomidine (synergy – hot plate; additive – tail flick); (b, e) CP55,940 and morphine (synergy – both assays); and (c, f) dexmedetomidine and morphine (additive – both assays).
Figure 6
Figure 6
Isobolograms for the effects of simultaneous s.c. administration of CP55,940 with dexmedetomidine in 1 : 1, 3 : 1 and 1 : 3 fixed ratios of ED50 of drug A (dexmedetomidine) : ED50 drug of B (CP55,940) in the (a) hot plate and (b) tail flick assays in conscious mice. The line in each panel connects the ED50 of drug A on the x-axis and the ED50 of drug B on the y-axis and represents the locus of points of dose combinations for purely additive interactions. Symbols represent theoretical additive and experimental ED50 values, with their associated 95% confidence intervals. Synergistic interactions were found for all dose ratios in the hot plate assay, while additive interactions occurred in the tail flick assay.
Figure 7
Figure 7
Isobolograms for the effects of simultaneous s.c. administration of drug combinations in hot plate and tail flick assays in conscious mice. The lines (black: hot plate; grey: tail flick) in each panel connect the ED50 of drug A on the x-axis and the ED50 of drug B on the y-axis and represent the locus of points of dose combinations for purely additive interactions. Symbols represent theoretical additive and experimental ED50 values, with their associated 95% confidence intervals. The drug combinations were (a) CP55,940 and dexmedetomidine; (b) CP55,940 and morphine; and (c) dexmedetomidine and morphine. Fixed ratios of ED50 of drug A : ED50 of drug B were 1 : 1 (a–c), 3 : 1 (a) and 1 : 3 (a) for the hot plate (black) and tail flick (grey) assays, respectively. Note that for each agonist, the ED50 values for antinociception in the hot plate assay were generally three-fold greater than in the tail flick assay.

Similar articles

Cited by

References

    1. ASHTON C.H. Pharmacology and effects of cannabis: a brief review. Br. J. Psychiatry. 2001;178:101–106. - PubMed
    1. BEHBEHANI M.M. Functional characteristics of the midbrain periaqueductal gray. Prog. Neurobiol. 1995;46:575–605. - PubMed
    1. CHAPERON F., THIEBOT M.H. Behavioral effects of cannabinoid agents in animals. Crit. Rev. Neurobiol. 1999;13:243–281. - PubMed
    1. CICHEWICZ D.L., MCCARTHY E.A. Antinociceptive synergy between Δ9-tetrahydrocannabinol and opioids after oral administration. J. Pharmacol. Exp. Ther. 2003;304:1010–1015. - PubMed
    1. COURSIN D.B., MACCIOLI G.A. Dexmedetomidine. Curr. Opin. Crit. Care. 2001;7:221–226. - PubMed

MeSH terms