

Individual differences in initial sensitivity and acute tolerance predict patterns of chronic drug tolerance to nitrous-oxide-induced hypothermia in rats
- PMID: 15778887
- PMCID: PMC1470882
- DOI: 10.1007/s00213-005-2219-1
Individual differences in initial sensitivity and acute tolerance predict patterns of chronic drug tolerance to nitrous-oxide-induced hypothermia in rats
Abstract
Rationale: A preventive strategy for drug addiction would benefit from being able to identify vulnerable individuals. Understanding how an individual responds during an initial drug exposure may be useful for predicting how that individual will respond to repeated drug administrations.
Objectives: This study investigated whether individual differences in initial drug sensitivity and acute tolerance can predict how chronic tolerance develops.
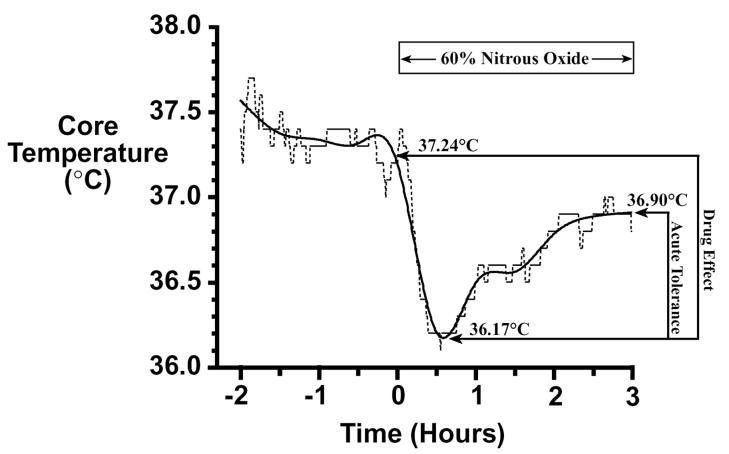
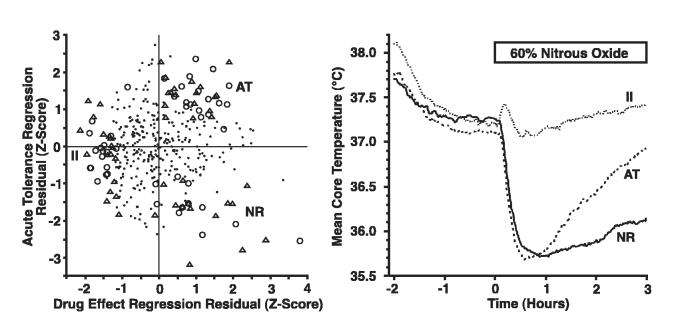
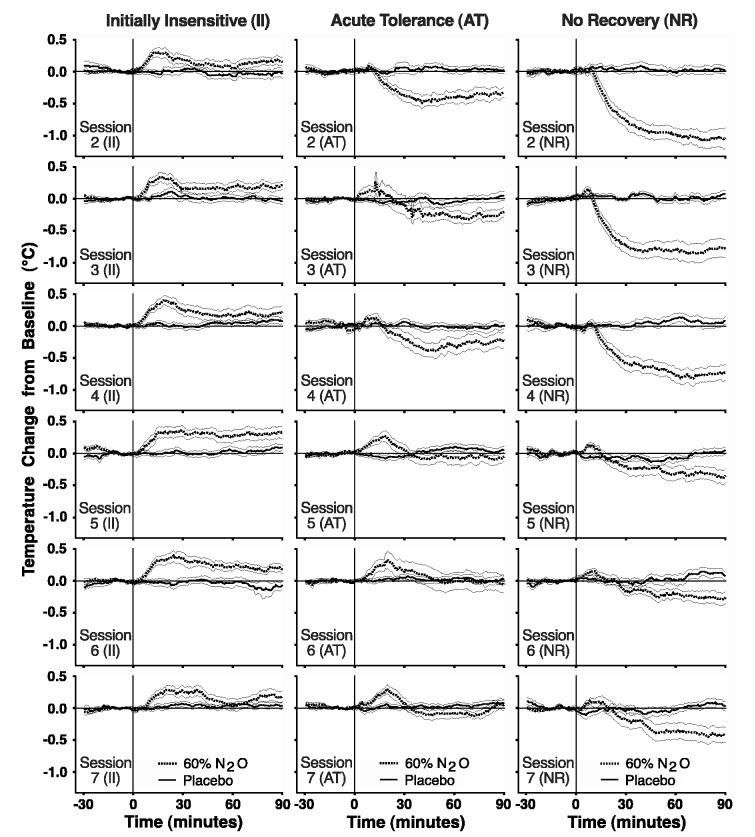
Methods: During an initial 3-h administration of 60% nitrous oxide (N(2)O), male Long-Evans rats were screened for N(2)O's hypothermic effect into subsets based on being initially insensitive (II), sensitive with acute tolerance (AT), or sensitive with no intrasessional recovery (NR). Animals in each individual difference category were randomly assigned to receive six 90-min exposures of either 60% N(2)O or placebo gas. Core temperature was measured telemetrically.
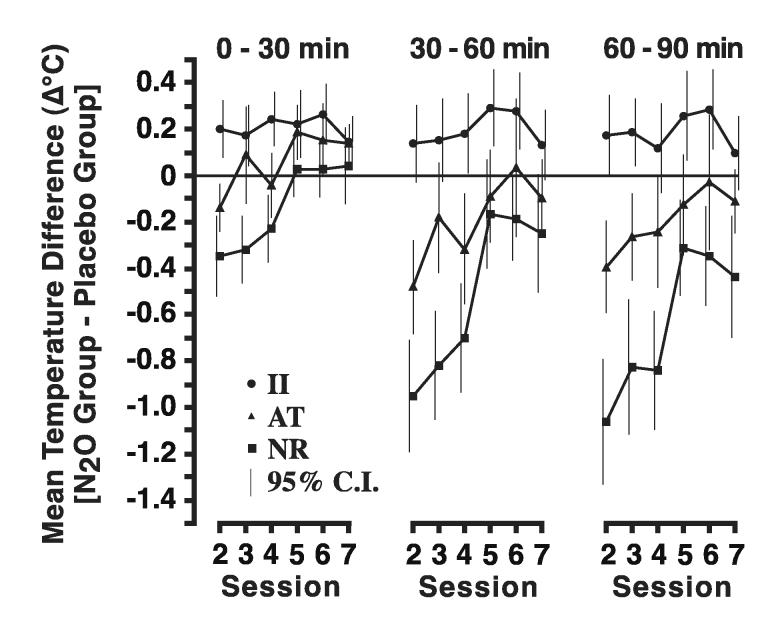
Results: Rats that exhibited a comparable degree of hypothermia during an initial N(2)O exposure, but differed in acute tolerance development, developed different patterns of chronic tolerance. Specifically, the NR group did not become fully tolerant over repeated N(2)O exposures while the AT group developed an initial hyperthermia followed by a return of core temperature to control levels indicative of full tolerance development. By the second N(2)O exposure, the II group breathing N(2)O became hyperthermic relative to the placebo control group and this hyperthermia persisted throughout the multiple N(2)O exposures.
Conclusions: Individual differences in initial drug sensitivity and acute tolerance development predict different patterns of chronic tolerance. The hypothesis is suggested that individual differences in opponent-adaptive responses may mediate this relationship.
Figures
References
-
- Baker TB, Piper ME, McCarthy DE, Majeskie MR, Fiore MC. Addiction motivation reformulated: an affective processing model of negative reinforcement. Psychol Rev. 2004;111:33–51. - PubMed
-
- Bell RL, Stewart RB, Woods JE, 2nd, Lumeng L, Li TK, Murphy JM, McBride WJ. Responsivity and development of tolerance to the motor impairing effects of moderate doses of ethanol in alcohol-preferring (P) and - nonpreferring (NP) rat lines. Alcohol Clin Exp Res. 2001;25:644–650. - PubMed
-
- Brick J, Pohorecky LA, Faulkner W, Adams MN. Circadian variations in behavioral and biological sensitivity to ethanol. Alcohol Clin Exp Res. 1984;8:204–211. - PubMed
-
- Browman KE, Rustay NR, Nikolaidis N, Crawshaw L, Crabbe JC. Sensitivity and tolerance to ethanol in mouse lines selected for ethanol-induced hypothermia. Pharmacol Biochem Behav. 2000;67:821–829. - PubMed
-
- Crabbe JC. Tolerance to ethanol hypothermia in HOT and COLD mice. Alcohol Clin Exp Res. 1994;18:42–46. - PubMed
Publication types
MeSH terms
Substances
Grants and funding
LinkOut - more resources
Full Text Sources
Medical
