

Natural allelic variation in the temperature-compensation mechanisms of the Arabidopsis thaliana circadian clock
- PMID: 15781708
- PMCID: PMC1449708
- DOI: 10.1534/genetics.104.035238
Natural allelic variation in the temperature-compensation mechanisms of the Arabidopsis thaliana circadian clock
Abstract
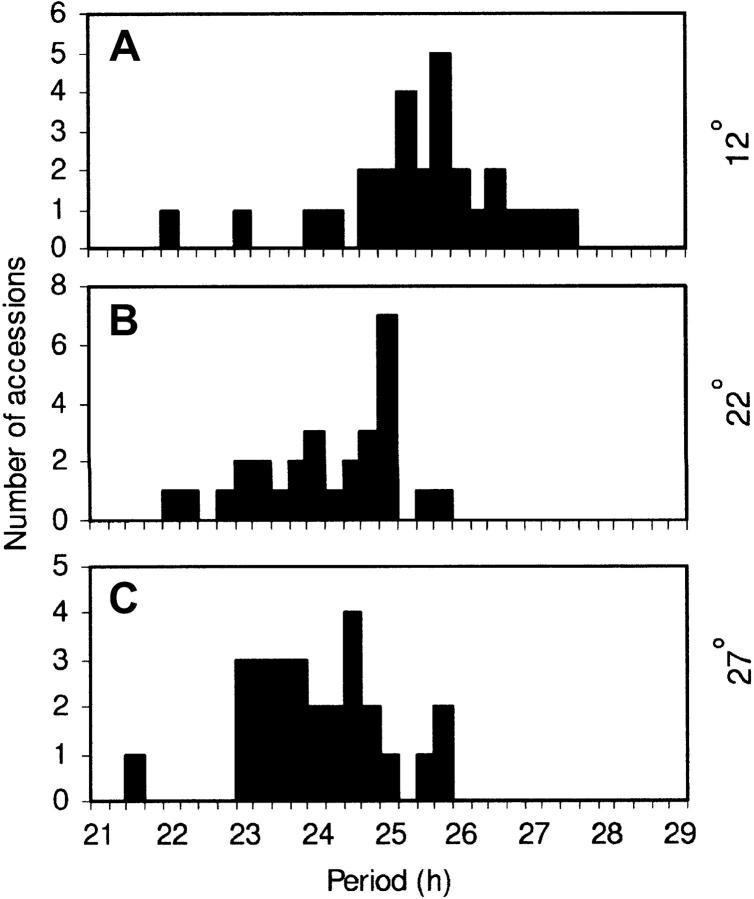
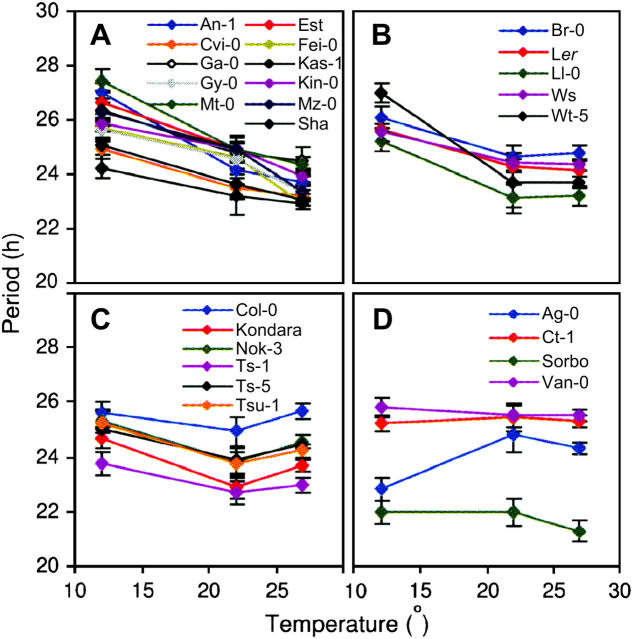
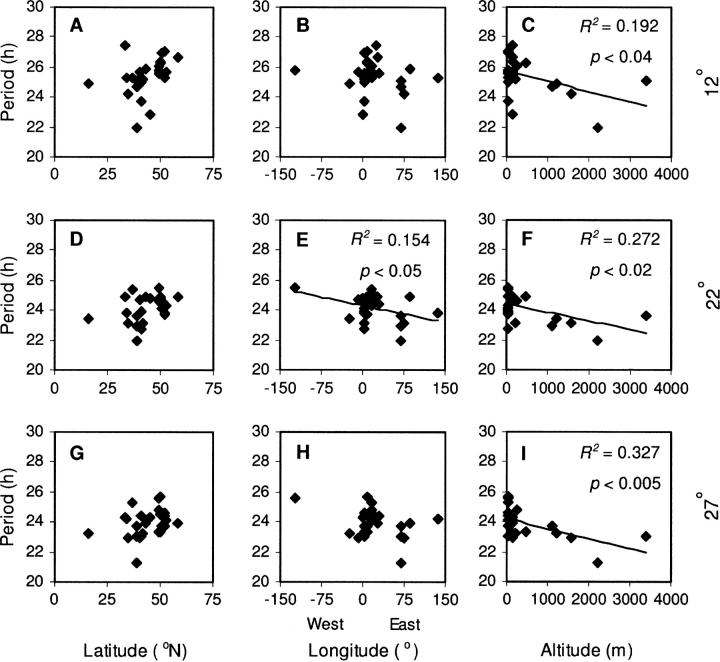
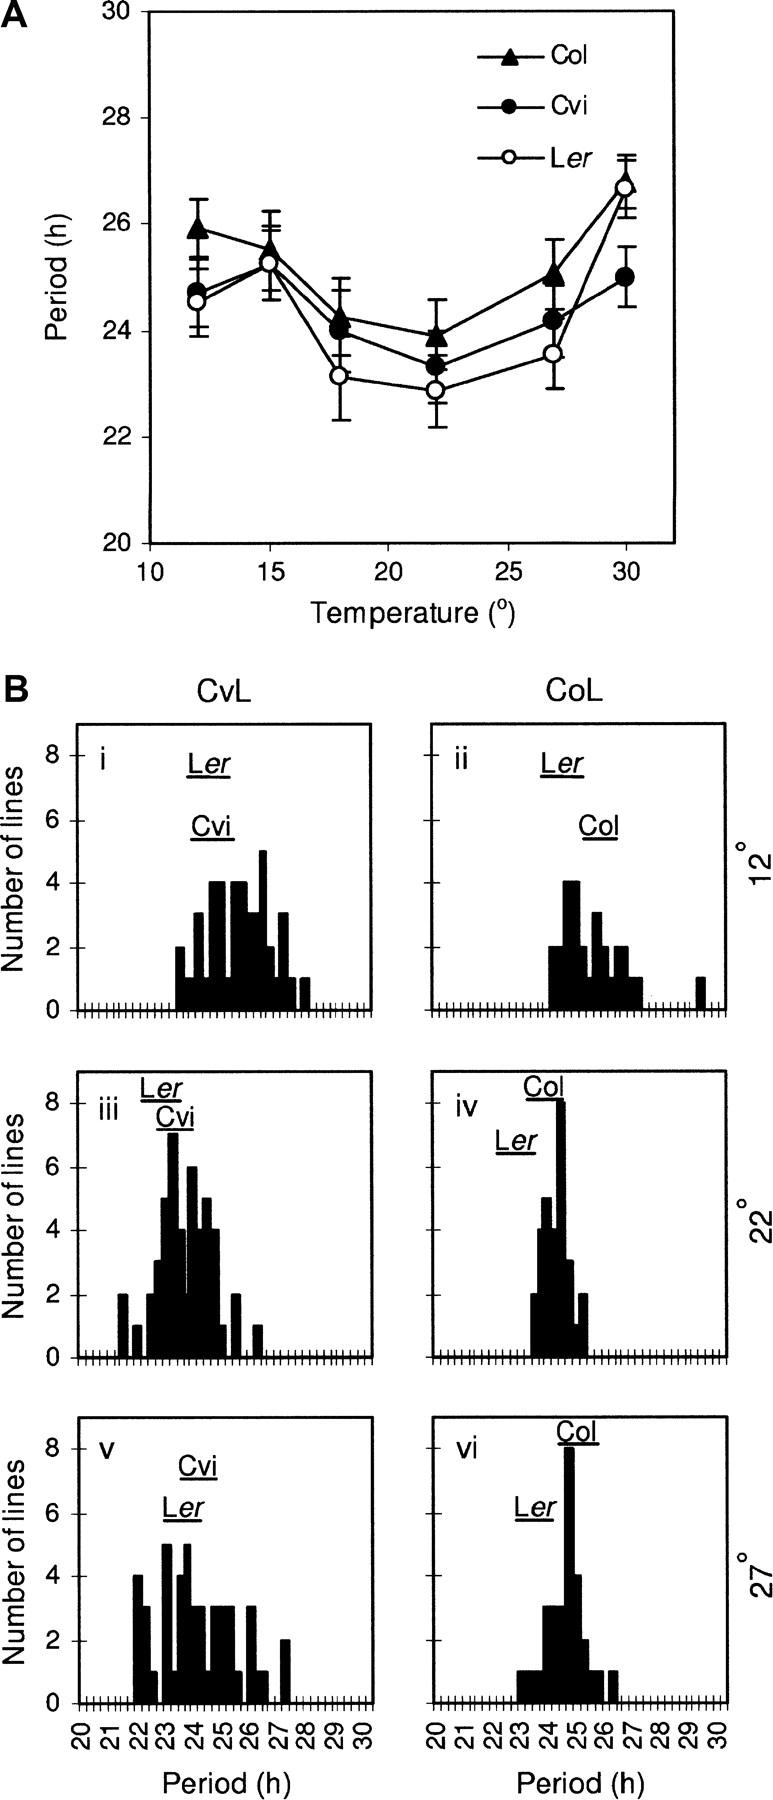
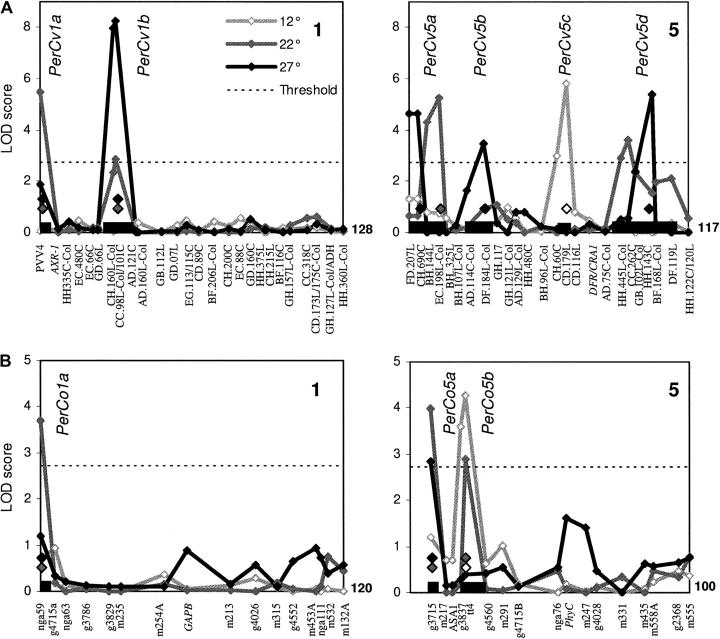
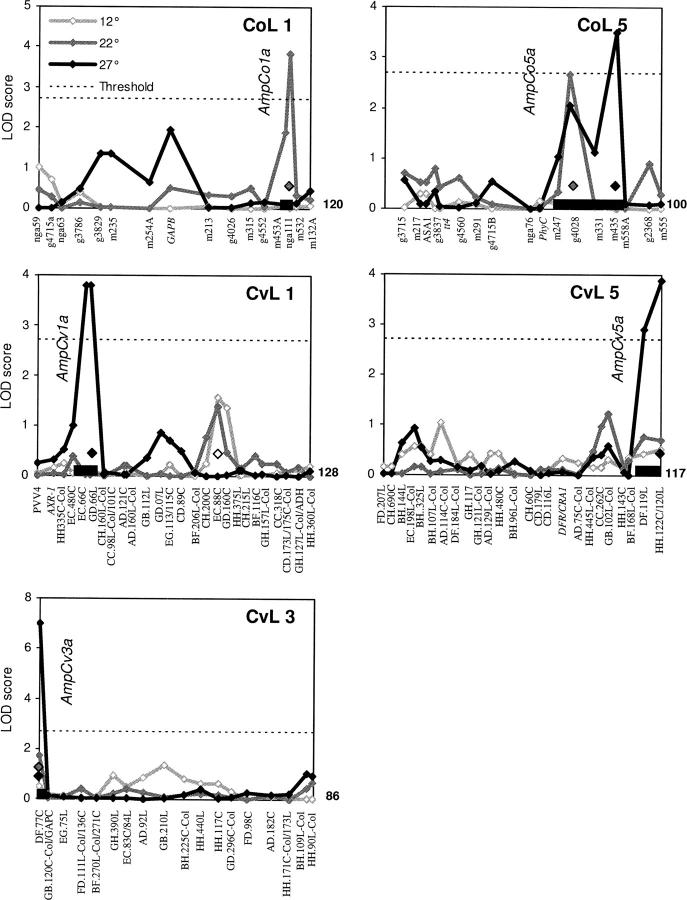
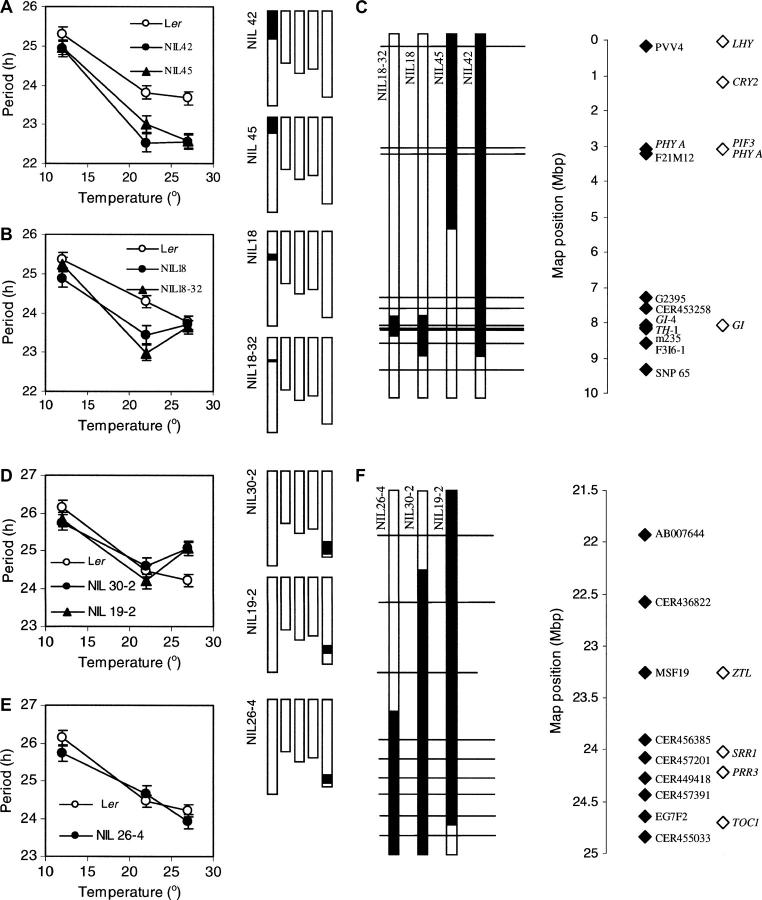
Temperature compensation is a defining feature of circadian oscillators, yet no components contributing to the phenomenon have been identified in plants. We tested 27 accessions of Arabidopsis thaliana for circadian leaf movement at a range of constant temperatures. The accessions showed varying patterns of temperature compensation, but no clear associations to the geographic origin of the accessions could be made. Quantitative trait loci (QTL) were mapped for period and amplitude of leaf movement in the Columbia by Landsberg erecta (CoL) and Cape Verde Islands by Landsberg erecta (CvL) recombinant inbred lines (RILs) at 12 degrees , 22 degrees , and 27 degrees . Six CvL and three CoL QTL were located for circadian period. All of the period QTL were temperature specific, suggesting that they may be involved in temperature compensation. The flowering-time gene GIGANTEA and F-box protein ZEITLUPE were identified as strong candidates for two of the QTL on the basis of mapping in near isogenic lines (NILs) and sequence comparison. The identity of these and other candidates suggests that temperature compensation is not wholly determined by the intrinsic properties of the central clock proteins in Arabidopsis, but rather by other genes that act in trans to alter the regulation of these core proteins.
Figures
Similar articles
-
Natural allelic variation identifies new genes in the Arabidopsis circadian system.Plant J. 1999 Oct;20(1):67-77. doi: 10.1046/j.1365-313x.1999.00577.x. Plant J. 1999. PMID: 10571866
-
Analysis of phase of LUCIFERASE expression reveals novel circadian quantitative trait loci in Arabidopsis.Plant Physiol. 2006 Apr;140(4):1464-74. doi: 10.1104/pp.105.074518. Epub 2006 Feb 3. Plant Physiol. 2006. PMID: 16461388 Free PMC article.
-
Analysis of natural allelic variation at flowering time loci in the Landsberg erecta and Cape Verde Islands ecotypes of Arabidopsis thaliana.Genetics. 1998 Jun;149(2):749-64. doi: 10.1093/genetics/149.2.749. Genetics. 1998. PMID: 9611189 Free PMC article.
-
Genetic architecture of the circadian clock and flowering time in Brassica rapa.Theor Appl Genet. 2011 Aug;123(3):397-409. doi: 10.1007/s00122-011-1592-x. Epub 2011 Apr 20. Theor Appl Genet. 2011. PMID: 21505830
-
An overview of natural variation studies in the Arabidopsis thaliana circadian clock.Semin Cell Dev Biol. 2013 May;24(5):422-9. doi: 10.1016/j.semcdb.2013.03.006. Epub 2013 Apr 1. Semin Cell Dev Biol. 2013. PMID: 23558216 Review.
Cited by
-
Genetic Architecture of Natural Variation in Thermal Responses of Arabidopsis.Plant Physiol. 2015 Sep;169(1):647-59. doi: 10.1104/pp.15.00942. Epub 2015 Jul 20. Plant Physiol. 2015. PMID: 26195568 Free PMC article.
-
Functional analysis of amino-terminal domains of the photoreceptor phytochrome B.Plant Physiol. 2010 Aug;153(4):1834-45. doi: 10.1104/pp.110.153031. Epub 2010 Jun 7. Plant Physiol. 2010. PMID: 20530216 Free PMC article.
-
The circadian clock ticks in plant stress responses.Stress Biol. 2022 Mar 1;2(1):15. doi: 10.1007/s44154-022-00040-7. Stress Biol. 2022. PMID: 37676516 Free PMC article. Review.
-
FBH1 affects warm temperature responses in the Arabidopsis circadian clock.Proc Natl Acad Sci U S A. 2014 Oct 7;111(40):14595-600. doi: 10.1073/pnas.1416666111. Epub 2014 Sep 22. Proc Natl Acad Sci U S A. 2014. PMID: 25246594 Free PMC article.
-
The plant circadian clock looks like a traditional Japanese clock rather than a modern Western clock.Plant Signal Behav. 2015;10(12):e1087630. doi: 10.1080/15592324.2015.1087630. Plant Signal Behav. 2015. PMID: 26382718 Free PMC article.
References
-
- Alabadi, D., T. Oyama, M. J. Yanovsky, F. G. Harmon, P. Mas et al., 2001. Reciprocal regulation between TOC1 and LHY/CCA1. Science 293: 880–883. - PubMed
-
- Alonso-Blanco, C., and M. Koornneef, 2000. Naturally occurring variation in Arabidopsis: an underexploited resource for plant genetics. Trends Plant Sci. 5: 22–29. - PubMed
-
- Alonso-Blanco, C., A. J. M. Peeters, M. Koornneef, C. Lister, C. Dean et al., 1998. b Development of an AFLP based linkage map of Ler, Col and Cvi Arabidopsis thaliana ecotypes and construction of a Ler/Cvi recombinant inbred line population. Plant J. 14: 259–271. - PubMed
Publication types
MeSH terms
Associated data
- Actions
- Actions
LinkOut - more resources
Full Text Sources
Molecular Biology Databases
