

Protein encoding genes in an ancient plant: analysis of codon usage, retained genes and splice sites in a moss, Physcomitrella patens
- PMID: 15784153
- PMCID: PMC1079823
- DOI: 10.1186/1471-2164-6-43
Protein encoding genes in an ancient plant: analysis of codon usage, retained genes and splice sites in a moss, Physcomitrella patens
Abstract
Background: The moss Physcomitrella patens is an emerging plant model system due to its high rate of homologous recombination, haploidy, simple body plan, physiological properties as well as phylogenetic position. Available EST data was clustered and assembled, and provided the basis for a genome-wide analysis of protein encoding genes.
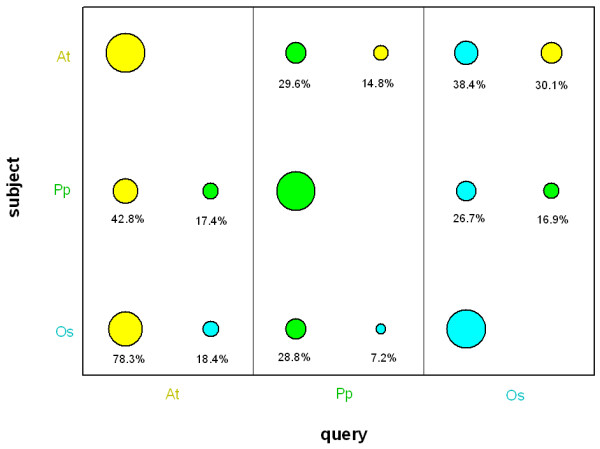
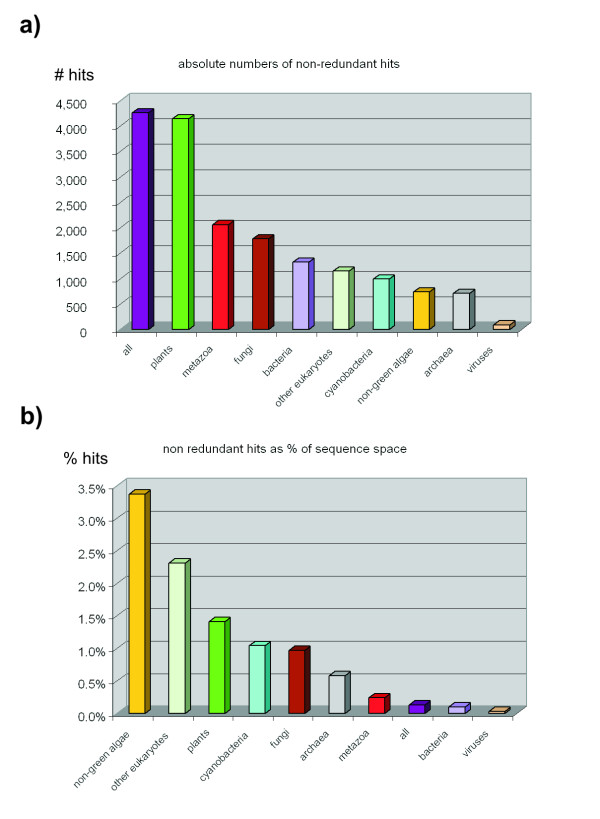
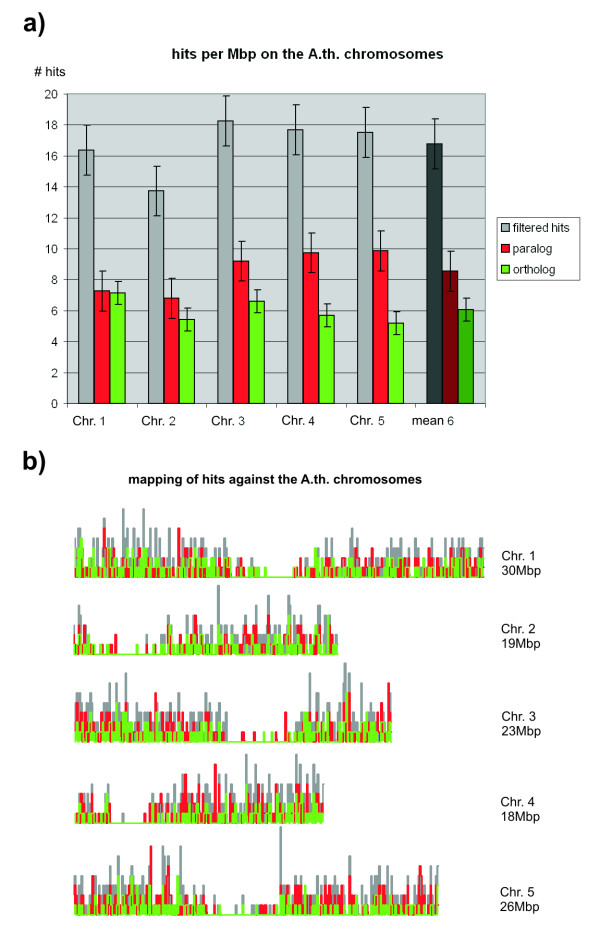
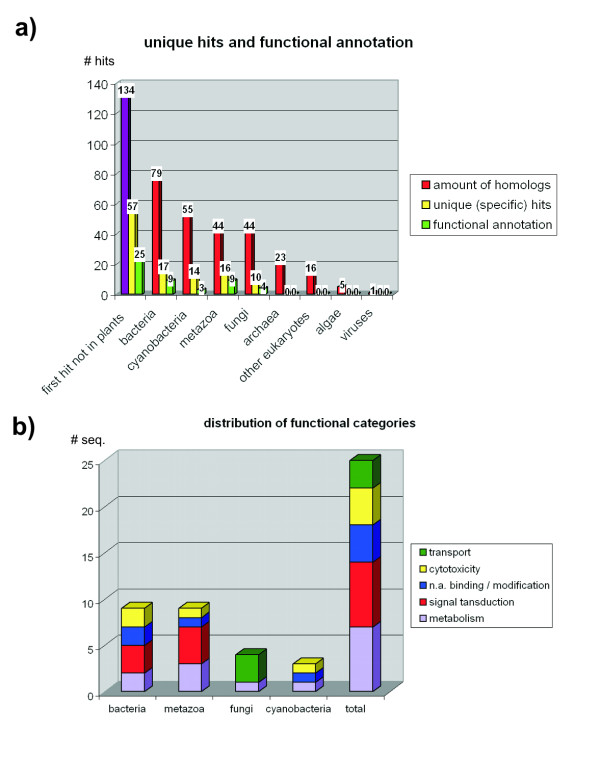
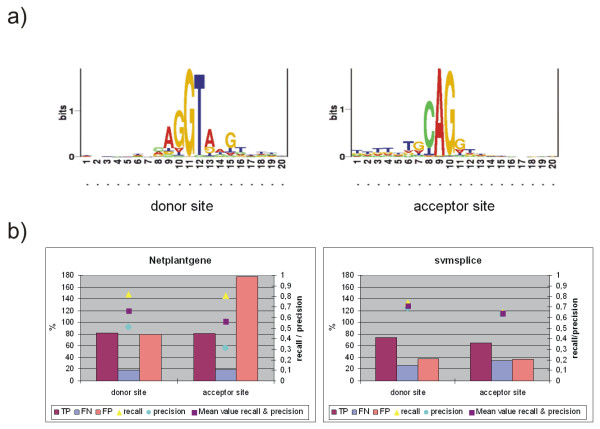
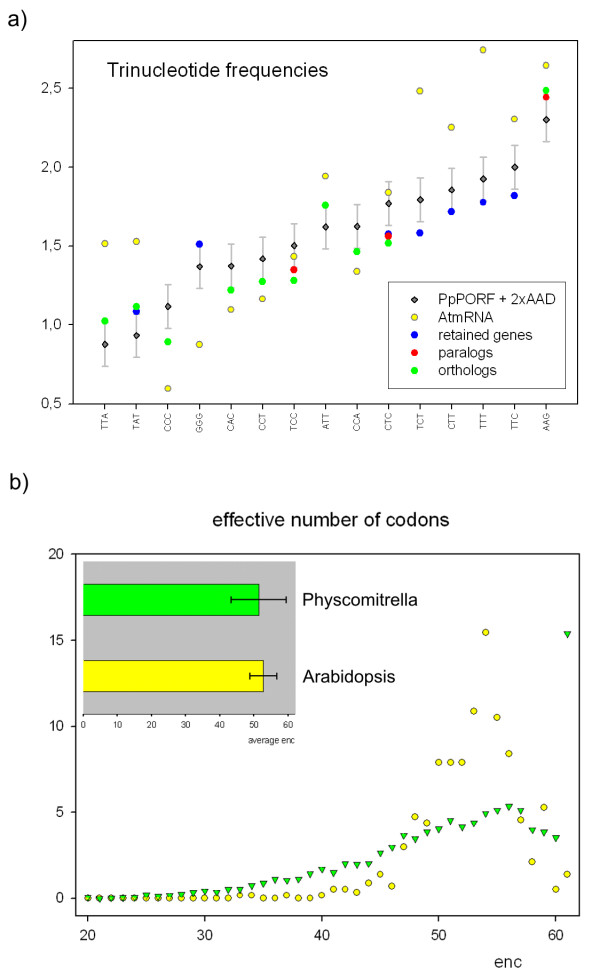
Results: We have clustered and assembled Physcomitrella patens EST and CDS data in order to represent the transcriptome of this non-seed plant. Clustering of the publicly available data and subsequent prediction resulted in a total of 19,081 non-redundant ORF. Of these putative transcripts, approximately 30% have a homolog in both rice and Arabidopsis transcriptome. More than 130 transcripts are not present in seed plants but can be found in other kingdoms. These potential "retained genes" might have been lost during seed plant evolution. Functional annotation of these genes reveals unequal distribution among taxonomic groups and intriguing putative functions such as cytotoxicity and nucleic acid repair. Whereas introns in the moss are larger on average than in the seed plant Arabidopsis thaliana, position and amount of introns are approximately the same. Contrary to Arabidopsis, where CDS contain on average 44% G/C, in Physcomitrella the average G/C content is 50%. Interestingly, moss orthologs of Arabidopsis genes show a significant drift of codon fraction usage, towards the seed plant. While averaged codon bias is the same in Physcomitrella and Arabidopsis, the distribution pattern is different, with 15% of moss genes being unbiased. Species-specific, sensitive and selective splice site prediction for Physcomitrella has been developed using a dataset of 368 donor and acceptor sites, utilizing a support vector machine. The prediction accuracy is better than those achieved with tools trained on Arabidopsis data.
Conclusion: Analysis of the moss transcriptome displays differences in gene structure, codon and splice site usage in comparison with the seed plant Arabidopsis. Putative retained genes exhibit possible functions that might explain the peculiar physiological properties of mosses. Both the transcriptome representation (including a BLAST and retrieval service) and splice site prediction have been made available on http://www.cosmoss.org, setting the basis for assembly and annotation of the Physcomitrella genome, of which draft shotgun sequences will become available in 2005.
Figures
References
-
- Theissen G, Münster T, Henschel K. Why don't mosses flower? New Phytologist. 2001;150:1–8. doi: 10.1046/j.1469-8137.2001.00089.x. - DOI
-
- Miller ND. Tertiary and quarternary fossils. In: Schuster RM, editor. New manual of Bryology. Vol. 2. Miyazaki: Hattori Bot Lab; 1984. pp. 1194–1232.
-
- Frahm J-P. Moose – lebende Fossilien. BuZ. 1994;24:120–124.
-
- Hohe A, Egener T, Lucht JM, Holtorf H, Reinhard C, Schween G, Reski R. An improved and highly standardised transformation procedure allows efficient production of single and multiple targeted gene-knockouts in a moss, Physcomitrella patens. Curr Genet. 2004;44:339–347. doi: 10.1007/s00294-003-0458-4. - DOI - PubMed
MeSH terms
Substances
LinkOut - more resources
Full Text Sources
Other Literature Sources
Research Materials
Miscellaneous
