. 2005 Mar 22;33(5):1722-36.
doi: 10.1093/nar/gki314. Print 2005.

Transcriptional regulation of two stage-specifically expressed genes in the protozoan parasite Toxoplasma gondii

Affiliations

Transcriptional regulation of two stage-specifically expressed genes in the protozoan parasite Toxoplasma gondii

Michael K Kibe et al. Nucleic Acids Res. .

Abstract

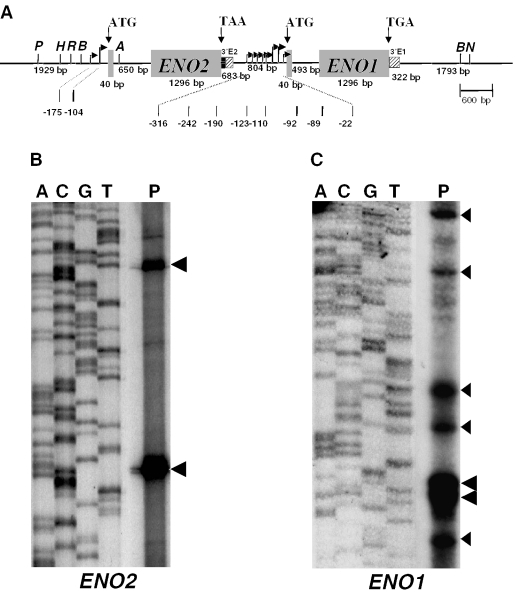
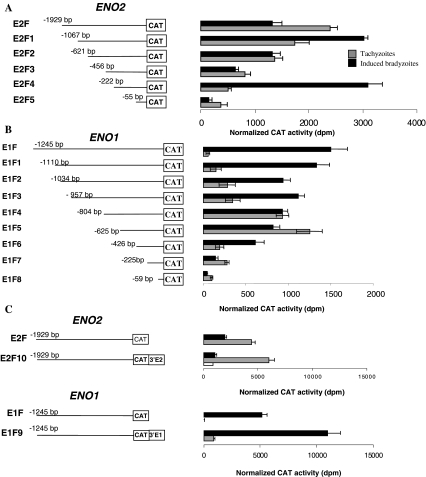
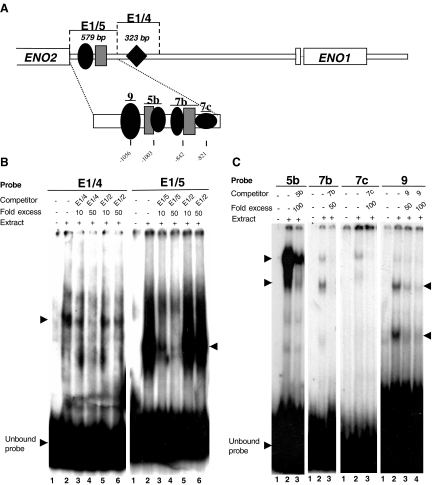
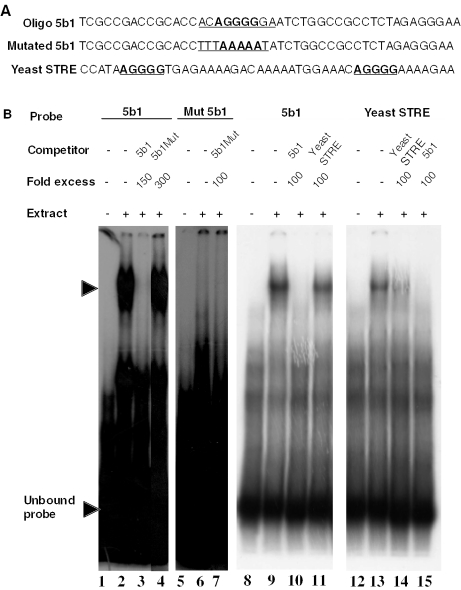
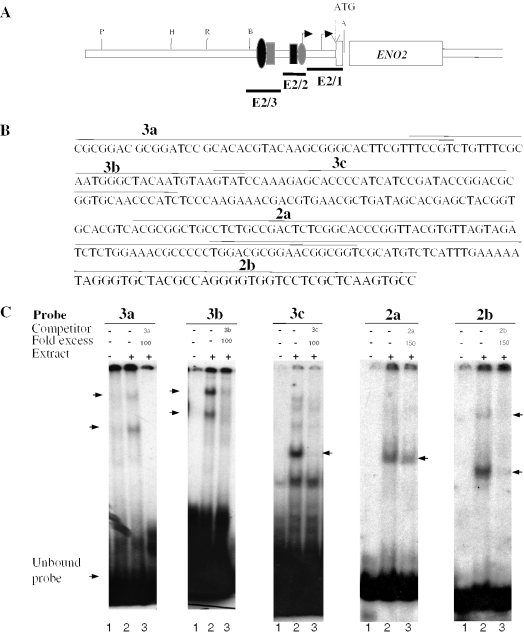
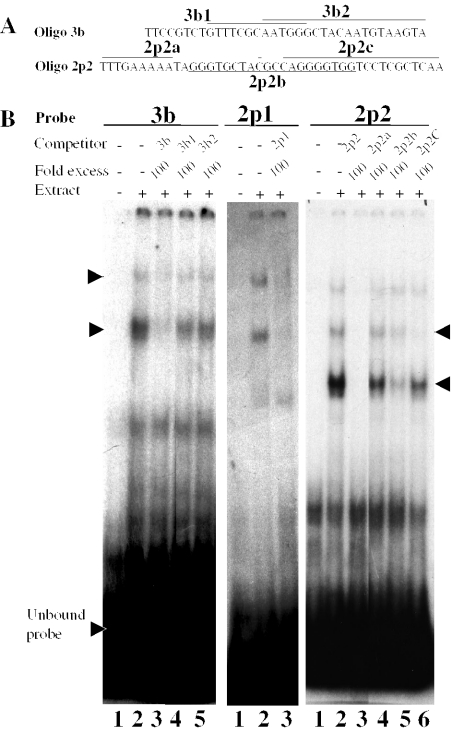
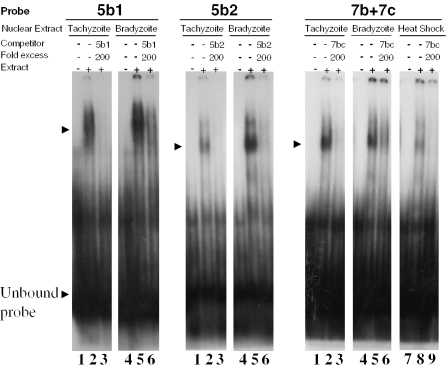
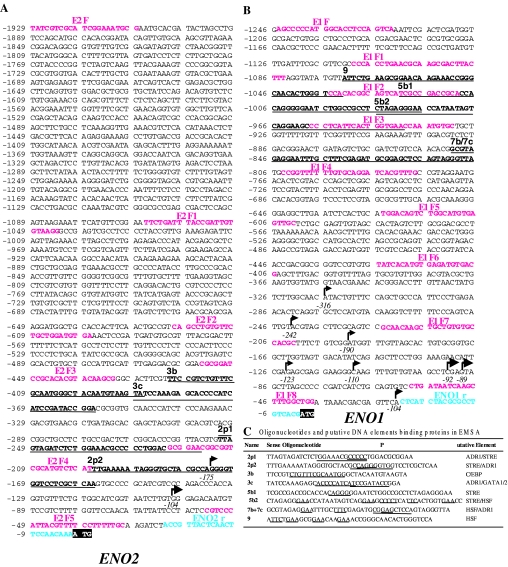
The protozoan parasite Toxoplasma gondii differentially expresses two distinct enolase isoenzymes known as ENO1 and ENO2, respectively. To understand differential gene expression during tachyzoite to bradyzoite conversion, we have characterized the two T.gondii enolase promoters. No homology could be found between these sequences and no TATA or CCAAT boxes were evident. The differential activation of the ENO1 and ENO2 promoters during tachyzoite to bradyzoite differentiation was investigated by deletion analysis of 5'-flanking regions fused to the chloramphenicol acetyltransferase reporter followed by transient transfection. Our data indicate that in proliferating tachyzoites, the repression of ENO1 involves a negative distal regulatory region (nucleotides -1245 to -625) in the promoter whereas a proximal regulatory region in the ENO2 promoter directs expression at a low level. In contrast, the promoter activity of ENO1 is highly induced following the conversion of tachyzoites into resting bradyzoites. The ENO2 promoter analysis in bradyzoites showed that there are two upstream repression sites (nucleotides -1929 to -1067 and -456 to -222). Furthermore, electrophoresis mobility shift assays demonstrated the presence of DNA-binding proteins in tachyzoite and bradyzoite nuclear lysates that bound to stress response elements (STRE), heat shock-like elements (HSE) and other cis-regulatory elements in the upstream regulatory regions of ENO1 and ENO2. Mutation of the consensus AGGGG sequence, completely abolished protein binding to an oligonucleotide containing this element. This study defines the first characterization of cis-regulatory elements and putative transcription factors involved in gene regulation of the important pathogen T.gondii.


Figures

Figure 1
Figure 1
(A) Tandemly arrayed organization of the two stage-specific T.gondii enolase genes. Approximately 9.3 kb of the whole sequence of both enolase loci is drawn to scale. Both ENO1 and ENO2 genes contained single dissimilar introns located 40 bp downstream of their ATG initiation. An intron of 493 bp is present in ENO1 genomic DNA while ENO2 contains an intron of 650 bp. The transcription start sites of ENO1 and ENO2 are indicated by vertical arrows and the numbers above correspond to their nucleotide positions relative to the ATG codon. 3′E2 indicates the 242 bp of the 3′-UTR of ENO2 (up to the polyadenylation signal) plus the 441 bp of the adjacent 5′-flanking region of ENO1 (distal promoter). 3′E1 corresponds to the 3′-UTR of ENO1. Some restriction enzyme sites ApaI (A), EcoRI (R), BamHI (B), HindIII (H), PstI (P) and NotI (N) are indicated. (B and C) Mapping of the transcription start sites of ENO2 and ENO1 by primer extension using RNA from tachyzoites and bradyzoites, respectively. Note that one major transcription start site and a minor one were obtained for ENO2 (arrows) whereas ENO1 gave two major, and at least five minor transcription start sites (arrows). The letters A, C, G and T indicate the products of a sequencing reaction that was run along the primer extension fragments for size determination.
Figure 2
Figure 2
Identification of transcriptional regulatory elements in the ENO1 and ENO2 genes by transient CAT assays. Transfections of tachyzoites were performed with ENO2 (A) and ENO1 (B) promoter–reporter constructs that are schematically depicted on the left of the panels. The transfected tachyzoites were also subjected to stress thereby converting to bradyzoites (see Materials and Methods). (C) Activities of the ENO1 and ENO2 promoters during tachyzoite to bradyzoite conversion. The plasmids E2F or E1F contain the 3′-UTR of SAG1 gene while E2F10 and E1F9 contain the 3′-UTR of ENO2 and ENO1, respectively. The CAT-constructs depicted on the left-hand side (E2F versus E2F10 and E1F versus E1F9) were transfected into tachyzoites and these organisms were divided equally into two flasks of human foreskin fibroblasts. After 6 h of invasion, one flask was subjected to experimental stress conditions to induce bradyzoite conversion and the second flask was kept in tachyzoite growth conditions (see Materials and Methods). Levels of CAT signal in tachyzoites and bradyzoites were determined after removing the promoterless CAT vector activities and adjustments for β-galactosidase activity used as internal control. The data are averages of four independent experiments. Error bars represent the mean and SD values of four independent experiments.
Figure 3
Figure 3
Evidence for specific protein–DNA interactions within the promoter of ENO1. (A) A schematic diagram showing the intergenic region between ENO1 and the 3′ end of ENO2 which was used to generate DNA fragments for proteins binding in EMSA. Their relative positions upstream of the ATG codon are indicated. The only two fragments E1/4 and E1/5 binding specifically to proteins in EMSA with tachyzoite nuclear extracts are indicated. The numbers 9, 5b, 7b and 7c represent the probes/competitors described in (C). (B) Electrophoretic band shift assay showing DNA–protein complexes with DNA fragments E1/4 and E1/5 located at the distal promoter region of ENO1. Lane 1, free probe; lane 2, no competitor; lane 3, specific competitor (10-fold excess of the homologous cold fragment); lane 4, specific competitor (50-fold excess); lane 5, unspecific competitor (10-fold excess of ENO1 fragment 2 or E1/2); and lane 6, same unspecific competitor (50-fold excess). The DNA–protein complexes are shown by arrowheads. (C) Gel shift binding assay with fragment 5b at the promoter of ENO1 and the nuclear extract from tachyzoites. Lane 1, free probe; lane 2, no competitor; and lane 3, specific competitor (100-fold excess). Arrowheads show the DNA–protein complexes. Gel shift binding assays with fragments 7b and 7c. Lane 1, free probe; lane 2, no competitor; and lane 3, specific competitor (50-fold or 100-fold excess). DNA–protein complexes with fragment 9. Lane 1, free probe; lane 2, no competitor; lane 3, specific competitor (50-fold excess); and lane 4, specific competitor oligonucleotide (100-fold excess).
Figure 4
Figure 4
Competitive band shift analysis with normal and mutated oligonucleotide 5b1. (A) The oligonucleotide 5b1, the mutated oligonucleotide 5b1 (mutated nucleotides are underlined and shown in boldface) and the canonical STRE of S.cerevisiae are shown. (B) Gel shift binding assay with oligonucleotide 5b1 (left-hand side) and the nuclear extract from tachyzoite: lane 1, free 5b1 probe, lane 2, 5b1 probe with tachyzoite nuclear extract and no competitor; lane 3, 5b1 probe with tachyzoite nuclear extract and specific competitor (150-fold excess); and lane 4, 5b1 probe with tachyzoite nuclear extract and specific competition with the mutated oligonucleotide 5b1 (100-fold excess). Lane 5, free mutated 5b1 probe; lane 6, mutated 5b1 probe with tachyzoite nuclear extract and no competitor; and lane 7, mutated 5b1 probe with tachyzoite nuclear extract and specific competition with the mutated oligonucleotide 5b1 (100-fold excess). Note the complete loss of protein binding with the mutated oligonucleotide 5b1. Lane 8, free 5b1 probe; lane 9, 5b1 probe with tachyzoite nuclear extract and no competitor; lane 10, 5b1 probe with tachyzoite nuclear extract and competition with specific competitor (100-fold excess); and lane 11, 5b1 probe with tachyzoite nuclear extract and competition with S.cerevisiae (yeast) STRE (100-fold excess). Lane 12, free yeast STRE probe; lane 13, yeast STRE probe with tachyzoite nuclear extract and no competitor; lane 14, yeast STRE probe with tachyzoite nuclear extract and competition with specific competitor; and lane 15, yeast STRE probe with tachyzoite nuclear extract and competition with oligonucleotide 5b1 (100-fold excess).
Figure 5
Figure 5
The proximal regulatory elements of ENO2 promoter is a target for DNA-binding proteins. (A) A schematic representation showing the 5′-flanking region of ENO2 that was used to generate DNA fragments for proteins binding in EMSA. The two fragments E2/2 and E2/3 binding specifically to proteins in EMSA using the tachyzoite nuclear extracts are indicated. (B) The nucleotide sequence of the contiguous E2/2 and E2/3 fragments is depicted with the oligonucleotides further designed for protein binding in EMSA. (C) Band shift assay with oligonucleotides from E2/2 and E2/3. Oligonucleotides 3a, 3b and 3c: lane 1, free probe; lane 2, no competitor; lane 3, specific competitor (50-fold or 100-fold excess); and oligonucleotides 2a and 2b: lane 1, free probe; lane 2, no competitor; lane 3, specific competitor (150-fold excess). The arrowheads show the DNA–protein complexes.
Figure 6
Figure 6
Localization of protein binding within the 35 and 42 bp DNA of oligonucleotides 3b and 2p2. (A) The sequence of oligonucleotide 3b and the extent of the oligonucleotides 3b1 and 3b2 used in the competition experiments using the tachyzoite nuclear extracts are shown. (B) Right panel: lane 1, free probe; lane 2, no competitor; lane 3, specific competitor (100-fold excess); and lanes 5 and 6 show competition with oligonucleotides 3b1 and 3b2, respectively (100-fold excess each). Arrowheads show the oligonucleotide–protein complexes. Band shift assay with oligonucleotides 2p1 and 2p2. The sequence of oligonucleotide 2p2 and the extent of the oligonucleotides 2p2a, 2p2b and 2p2c used in the competition experiments are shown in (A). Lane 1: free probe; lane 2, no competitor; and lane 3, specific competitor (100-fold excess). Lanes 4–6 show competition of labelled oligonucleotide 2p2 with the short overlapping self oligonucleotides shown in (A). Note the disappearance of the oligonucleotide protein complexes in lanes 5 and 6 (arrowed).
Figure 7
Figure 7
Increased DNA–protein interactions with nuclear extract from stress-induced bradyzoites. Electrophoretic band shift assays showing DNA–protein complexes with ENO1 promoter DNA oligonucleotides containing STRE motifs (5b1 and 5b2) or HSE-like motifs (7b+7c) and nuclear extract from non-stressed tachyzoites (lanes 1–3), nuclear extract from stress-induced bradyzoites (lanes 4–6) or nuclear extract from heat shock treated tachyzoites (oligo 7b+7c, lanes 7–9). Equal amount of nuclear extracts have been used. Lane 1, free probe; lane 2, probe with tachyzoite nuclear extract and no competitor; lane 3, probe with tachyzoite nuclear extract and specific competitor (200-fold excess of the homologous cold fragment); lane 4, free probe; lane 5, probe with stress-induced bradyzoite nuclear extract and specific competitor (200-fold excess); lane 6, probe with stress-induced bradyzoite nuclear extract and specific competitor (200-fold excess); lane 7, free probe; lane 8, probe with nuclear extract from tachyzoite heat shock treated and no competitor; and lane 9, probe with tachyzoite nuclear extract and specific competitor (200-fold excess). Arrowheads show the DNA–protein complexes.
Figure 8
Figure 8
(A and B) Overview of the results obtained by promoter analysis and by EMSAs. The promoter regions of ENO1 and ENO2 are shown. The forward primers used for CAT expressing constructs are indicated in red while the common reverse primers are shown in blue. The name of these constructs are displayed in red on top of the forward primers. The DNA fragments used in EMSAs are indicated by bold bars and underlined. The transcription start sites are shown by black arrows. The cis-regulatory elements identified are displayed as boldface, black, underlined sequences on top and at the beginning of the EMSA fragments. (C) The nature of cis-regulatory elements and the corresponding putative trans-acting or transcription factors are indicated in the table. The oligonucleotide sequences were checked for homology to sequences in the TRANSFAC and TFSEARCH databases.

Similar articles

Cited by

References

    1. Israelski D.M., Remington J.S. Toxoplasmosis in patients with cancer. Clin. Infect. Dis. 1993;17:423–435. - PubMed
    1. Luft B.J., Remington J.S. Toxoplasmic encephalitis in AIDS. Clin. Infect. Dis. 1992;15:211–222. - PubMed
    1. Desmonts G., Couvreur J. Toxoplasmosis in pregnacy and its transmission to the fetus. Bull. NY Acad. Med. 1974;50:146–159. - PMC - PubMed
    1. Donald R.G.K., Roos D.S. Stable molecular transformation of Toxoplasma gondii: a selectable dehydrofolate reductase-thymidylate synthase marker based on drug resistance in malaria. Proc. Natl Acad. Sci. USA. 1993;90:11703–11707. - PMC - PubMed
    1. Soldati D., Boothroyd J.C. Transient transfection and expression in the obligate intracellular parasite Toxoplasma gondii. Science. 1993;260:349–352. - PubMed

Publication types

MeSH terms

Associated data