. 2005 Apr 5;102(14):5233-8.
doi: 10.1073/pnas.0408892102. Epub 2005 Mar 22.

In vivo dynamics of retinal injury and repair in the rhodopsin mutant dog model of human retinitis pigmentosa

Affiliations

In vivo dynamics of retinal injury and repair in the rhodopsin mutant dog model of human retinitis pigmentosa

Artur V Cideciyan et al. Proc Natl Acad Sci U S A. .

Abstract

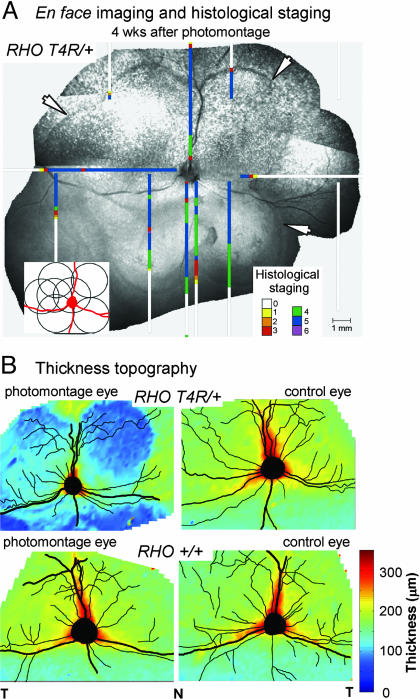
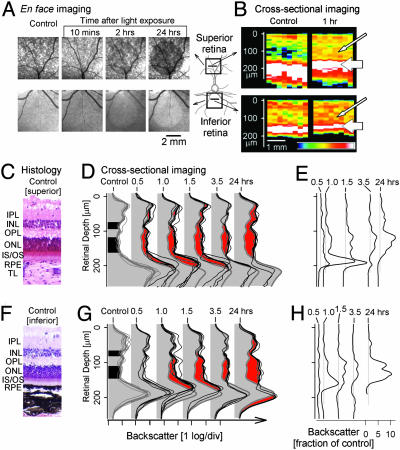
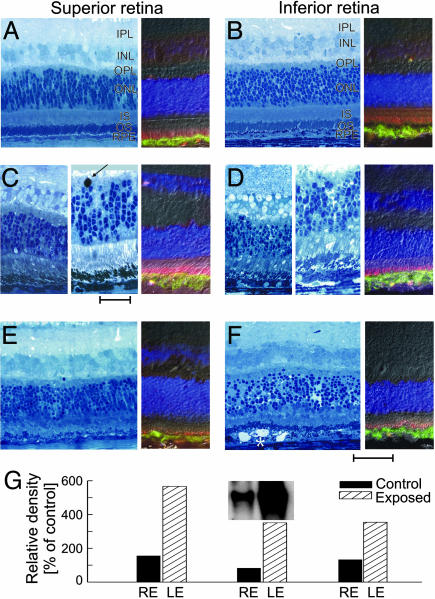
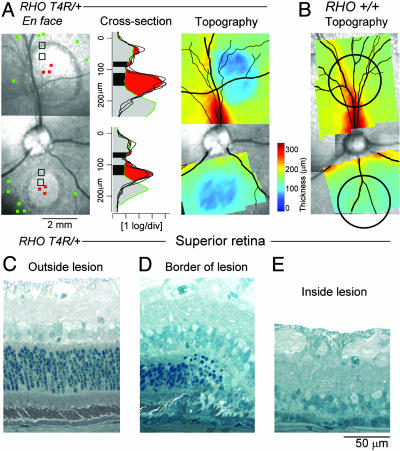
Genetic and environmental factors modify the severity of human neurodegenerations. Retinal degenerations caused by rhodopsin gene mutations show severity differences within and between families and even within regions of the same eye. Environmental light is thought to contribute to this variation. In the naturally occurring dog model of the human disorder, we found that modest light levels, as used in routine clinical practice, dramatically accelerated the neurodegeneration. Dynamics of acute retinal injury (consisting of abnormal intraretinal light scattering) were visualized in vivo in real time with high-resolution optical imaging. Long term consequences included fast or slow retinal degeneration or repair of injury depending on the dose of light exposure. These experiments provide a platform to study mechanisms of neuronal injury, repair, compensation, and degeneration. The data also argue for a gene-specific clinical trial of light reduction in human rhodopsin disease.


Figures

Fig. 1.
Fig. 1.
Consequences of clinical human retinal photography in the RHO mutant dog. (A) Digital montage of en face infrared images 4 wk after photography using seven standard overlapping fields (Inset). Superimposed on the retinal photograph are maps of retinal disease staging by light microscopy in this dog. Higher numbers represent more severe disease (11). (B) Topographical maps of retinal thickness on a pseudocolor scale derived from cross-sectional images. T, temporal; N, nasal.
Fig. 2.
Fig. 2.
In vivo detection of retinal alterations shortly after light exposure. (A) En face images in superior (Upper) and inferior (Lower) retinal locations before and after focal light exposure in a RHO mutant dog. (B) Cross-sectional images of infrared light backscatter intensity mapped to a pseudocolor scale in superior and inferior retina before and 1 h after the exposure. Vitreous is above each tomogram. Thin arrows point to regions of increased intraretinal light scatter after exposure; thick arrows point to the apparent vitreal movement of peak reflection. (C and F) Control retinal morphology from an unexposed eye of a RHO mutant dog at the superior and inferior locations of the focal light exposures. IPL, inner plexiform layer; INL, inner nuclear layer; TL, tapetum lucidum. (D and G) LRPs near the center of focal light exposures before and after exposure. Each thin trace represents data from a different eye. Thick gray traces are the average of control LRPs, and thick black traces are the average of LRPs at the specified time after exposure. Control traces include three unexposed RHO mutant eyes and one exposed and one unexposed wild-type eye. Black fill on the control LRPs delimits the two troughs of low backscatter corresponding to ONL and INL. Red fill represents the increase in intraretinal scatter as compared with control at each time point after the exposure. (E and H) Estimated change in the scatter coefficient of the retinal tissue as a function of retinal depth and time after the focal light exposure in superior and inferior loci. Curves have been shifted for clarity; gray vertical lines demarcate no change from control (unity ratio) for each time point.
Fig. 3.
Fig. 3.
Histopathology, immunocytochemistry, and AP-1 induction studies at early times after light exposure. (A and B) Control retina peripheral to the focal exposure. (C and D) Near center of lesion 2 h after exposure, there is massive shedding of rod photoreceptor OS tips that are located in the interphotoreceptor space or engulfed by RPE. OS are shorter, disorganized, and fragmented. Shown is the large pyknotic nucleus at the ONL/OPL interface (arrow). (E and F) Near center of lesion 24 h after exposure showing pyknosis of ONL, perinuclear and internuclear swelling in ONL, marked loss of rod and cone OS, and shortening of IS. RPE shows altered intracellular organization, and membranous whorls (*) accumulate in the interphotoreceptor space. (Scale bar is 50 μm for most panels, except Center of C and D, where scale bar is 25 μm.) Immunocytochemistry (AF Right) used RPE65 (green) and opsin (red) antibodies to label the RPE and photoreceptor OS, respectively; DAPI labels the nuclei in all retinal layers. (G) Increase in AP-1 activation in three RHO mutant dogs 1 h after light exposure.
Fig. 4.
Fig. 4.
Late retinal alterations after light exposure. (A) En face infrared images of a RHO mutant dog 4 wk after light exposure in superior and inferior retinal regions. Cross-sectional images near the center of the lesion (red squares) compared with loci outside the exposed region (green squares) demonstrate loss of the photoreceptor layer. Topographical maps show the retinal thickness on a pseudocolor scale and are superimposed on the en face image. (B) Topographical thickness maps in a wild-type dog 4 wk after focal exposures (black circles) indicate no change. (CE) Histological changes 4 wk after focal exposure in the same RHO mutant dog as shown in A in the superior retina. Regions shown are outside, inside, and at the border between light-exposed and nonexposed regions. (C) Outside the lesion, the retina is normal, but there are abrupt changes at the border, with loss of outer retinal tissue (D). Inside the light-exposed area (E), photoreceptors and RPE are not present.
Fig. 5.
Fig. 5.
Slow repair and slow degeneration with lower light exposures. (A) En face infrared imaging in the superior retina shows the progressive reduction of the extent and fading of a visible circular lesion over 25 wk. White arcs demarcate the extent of the lesion at 1 wk. Data from locations near the exposure boundary (yellow squares), more central to the lesion (red squares), and peripheral to exposure boundary (green squares) are shown in detail (B and C). (A Far Right) Retinal vessel map with black square showing location of en face images. (B and C) LRPs from individual locations (thin black traces) near the inside boundary (B) or more central to the lesion (C) and average control (thick green line) locations near the outside boundary of the lesion at various times after a focal exposure of 6 mJ·cm–2. The difference of mean scattering between inside versus outside the boundary is shown as yellow (B) or red (C). (D) Retinal thickness derived from the cross-sectional scans in B and C plotted as a function of time after the light exposure. Data points are mean ± 1 SD. Green lines show the control thickness (mean ± 1 SD) derived from unexposed green loci.

References

    1. Benn, S. C. & Woolf, C. J. (2004) Nat. Rev. Neurosci. 5, 686–700. - PubMed
    1. Pacione, L. R., Szego, M. J., Ikeda, S., Nishina, P. M. & McInnes, R. R. (2003) Annu. Rev. Neurosci. 26, 657–700. - PubMed
    1. Organisciak, D. T. & Winkler, B. S. (1994) Prog. Ret. Eye Res. 13, 1–29.
    1. Jacobson S. G. & McInnes, R. R. (2002) Nat. Genet. 32, 215–216. - PubMed
    1. Wenzel, A., Grimm, C., Samardzija, M. & Reme, C. E. (2005) Prog. Ret. Eye Res. 24, 275–306. - PubMed

Publication types

MeSH terms

LinkOut - more resources